Dear STEP community,
I’ve found some intrigging results in the STAMPS Standard Deviation export, for what I can’t find any explation yet.
I’m using an algorithm adapted from @thho StaMPS-Visualizer manual.
It follows:
%%% the ‘v-doa’ parameter is an example you can change it to your needs
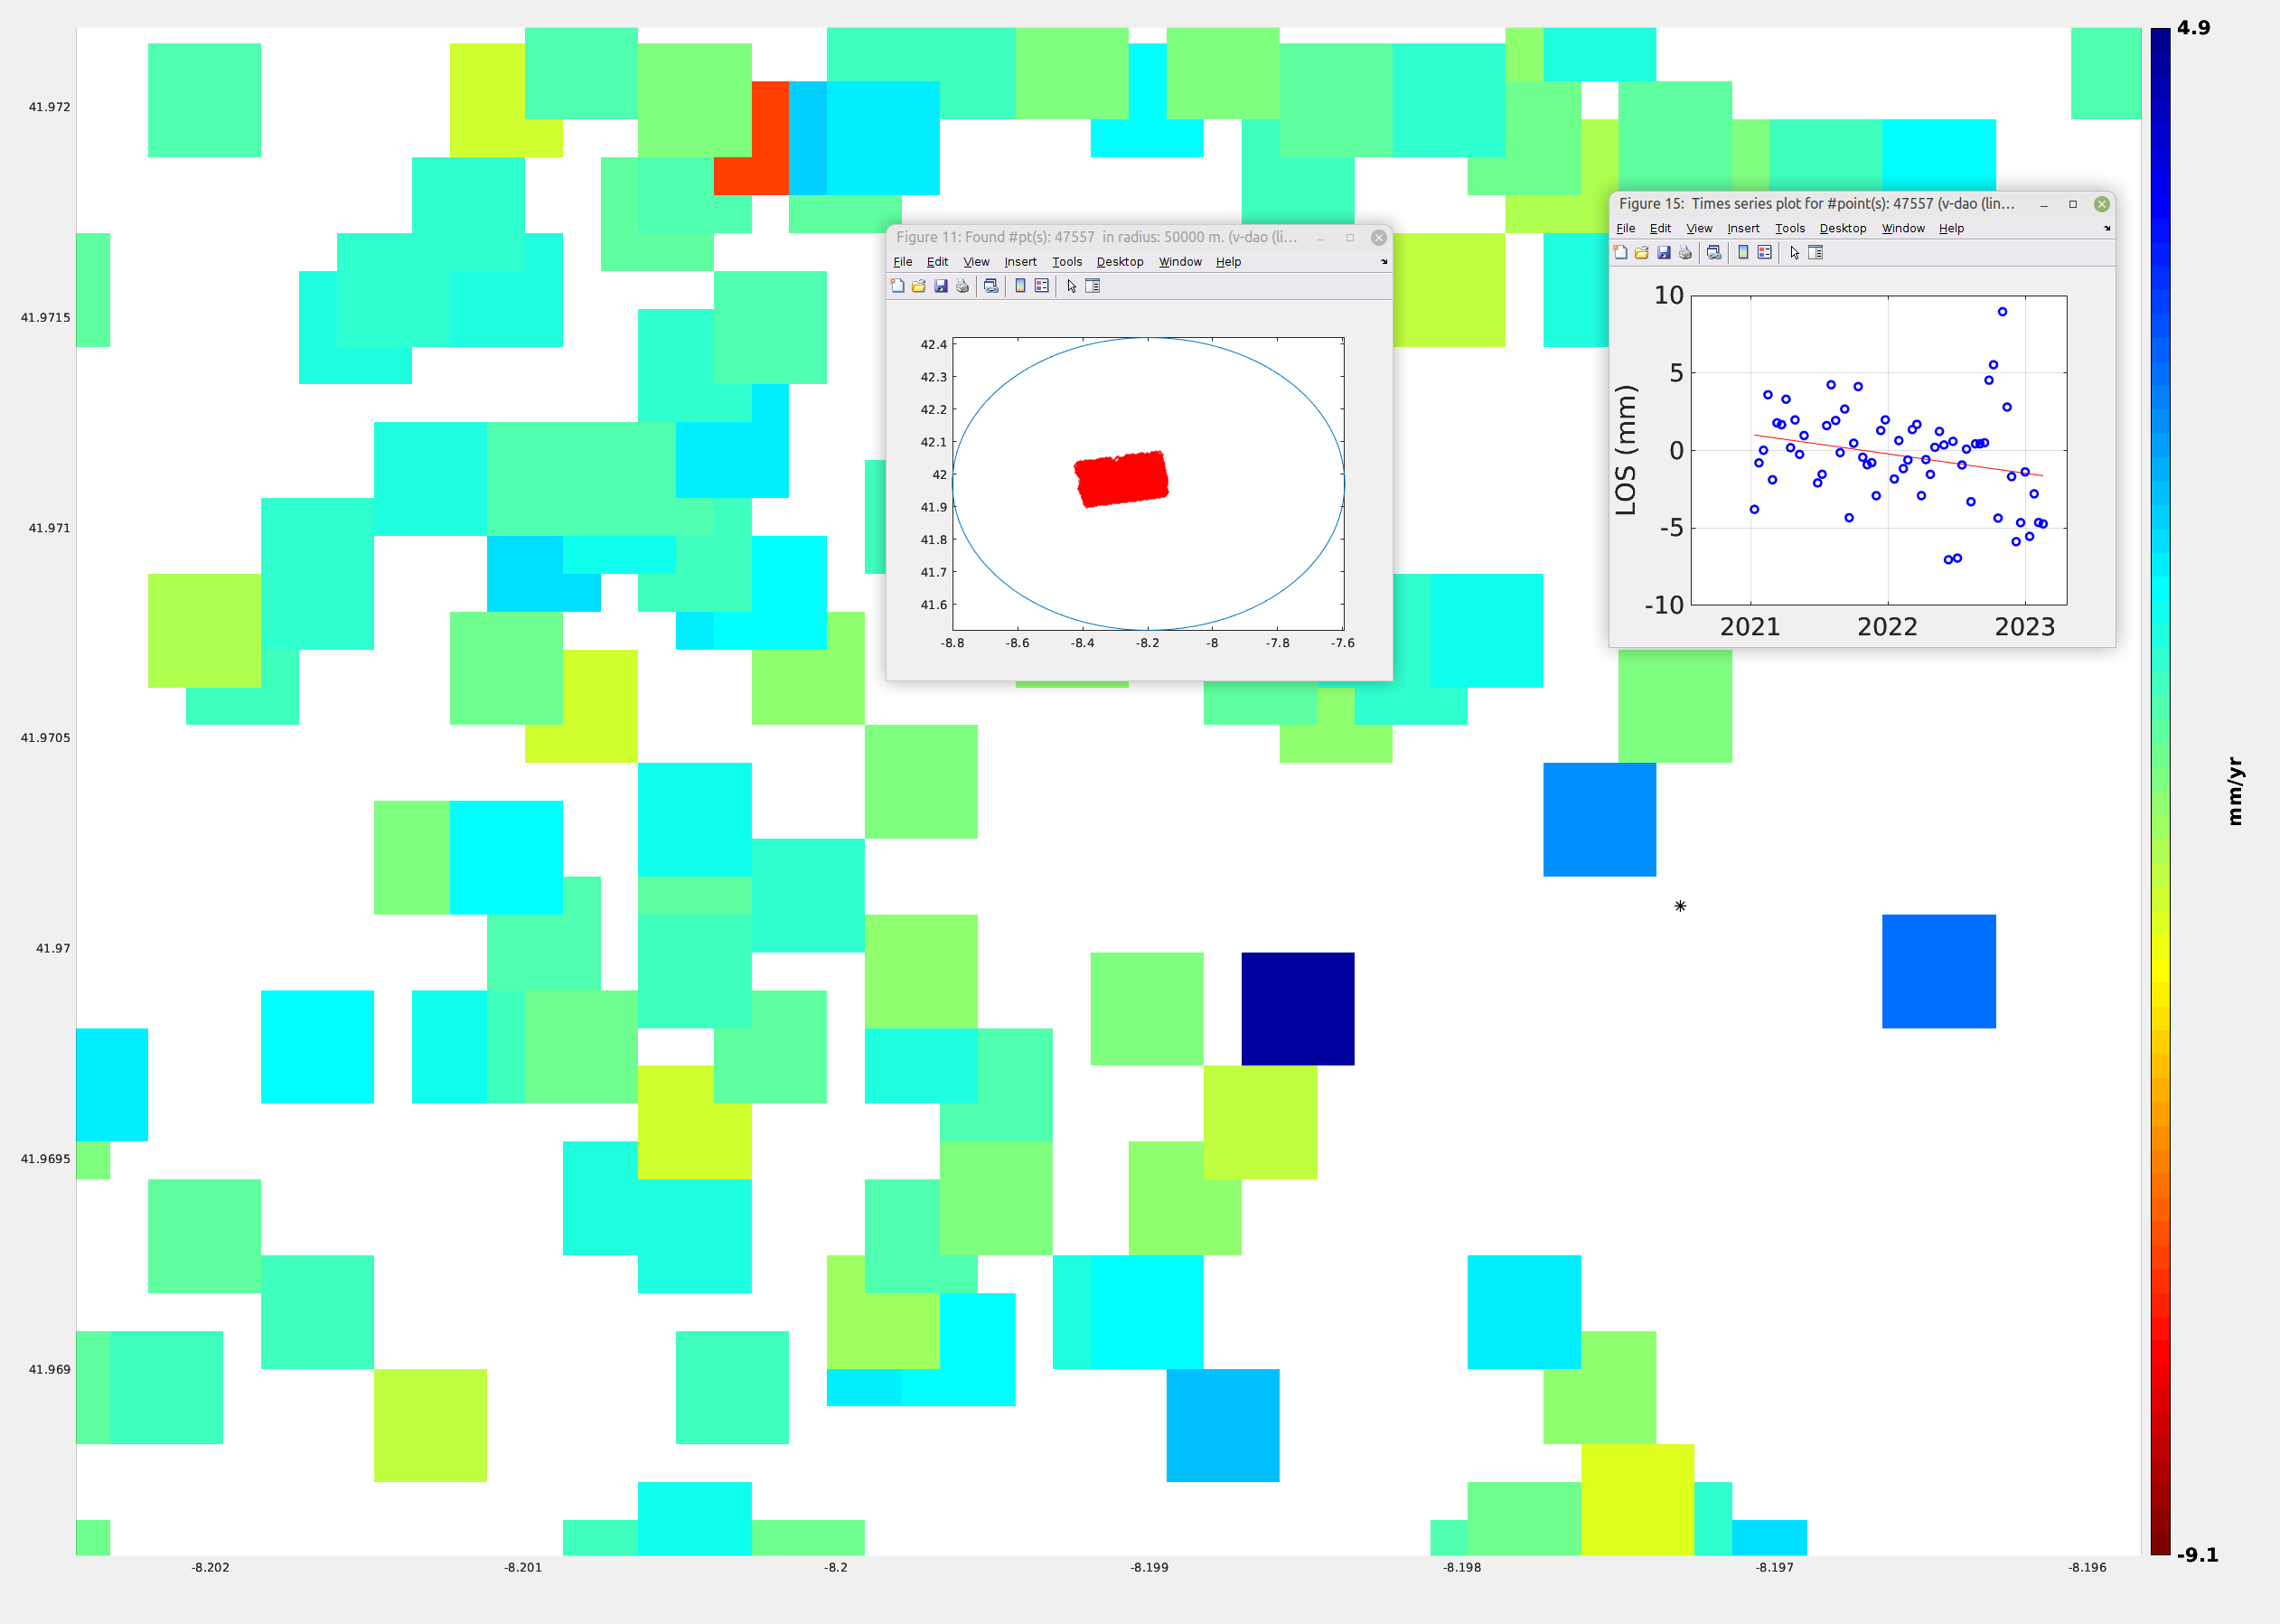
ps_plot(‘v-dao’,‘a_linear’,‘ts’);
%%% a new window will open
%%% in the new window select a radius and location of the radius center to select the PS to export
%%% the ‘v-dao’ parameter is an example you can change it to your needs
%%% but be sure that you use the same paramters as above in the ps_plot()!ps_plot(‘v-dao’,‘a_linear’,-1);
%%% loading phase displacement velocity from v-dao plot
load ps_plot_v-dao.mat;
%%% concatenation of phase velocity with time series usin lat lon
lon2_str = cellstr(num2str(lon2));
lat2_str = cellstr(num2str(lat2));
lonlat2_str = strcat(lon2_str, lat2_str);
lonlat_str = strcat(cellstr(num2str(lonlat(:,1))),cellstr(num2str(lonlat(:,2))));
ind = ismember(lonlat_str, lonlat2_str);
disp = ph_disp(ind); %% mean displacement velocity
disp_ts = ph_mm(ind,:); %% displacement time-series%%% leaving one column with zeros to fill with STD results (next)
%%% 1#id 2-3#lon-lat 4#vel 5#stdev 6-n# time-seriesexport_res_vel = [linspace(1,length(ind),length(ind))’ lonlat(ind,1) lonlat(ind,2) disp zeros(length(ind),1) disp_ts];
%%% To see time table (uncomment next line)
%%% datetime(day,‘ConvertFrom’,‘datenum’)%%% now lets load Time-series STANDAR DEVIATION for previous selected region
ps_plot(‘vs-dao’,‘a_linear’,-1);
load ps_plot_vs-dao.mat;%%% variable with STD values
export_res_vel(:,5)=ph_disp(ind);
export_res = [[zeros(1,5) m2xdate(day)'];export_res_vel];
export_res = table(export_res);
writetable(export_res,‘ts_peneda_Asc_20210111_20230218.csv’)
Every time I repeat this procedure for the following PS Time Series:
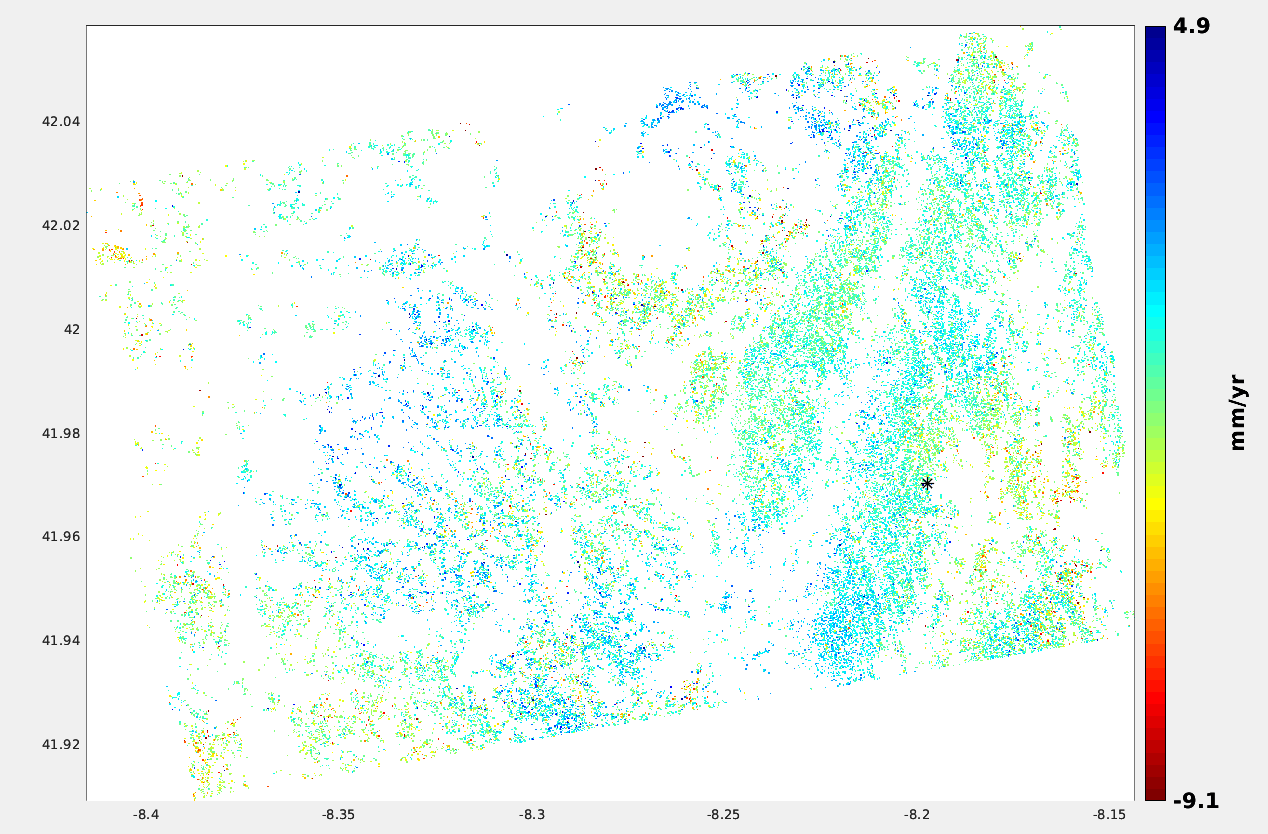
Using a 50 000 m radius and selecting the same reference lat lon (given by the small balck asterisk (*) in next image):
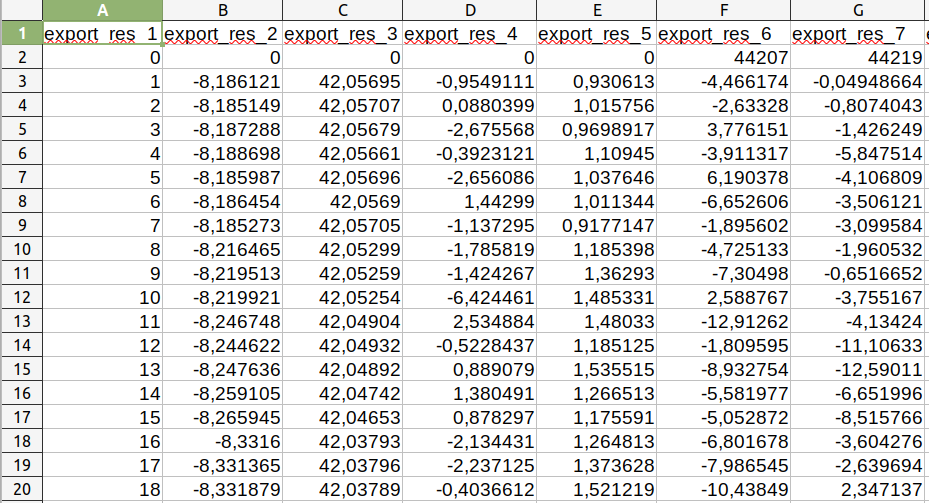
I always get different STD values, although the TS Velocities are always the same:
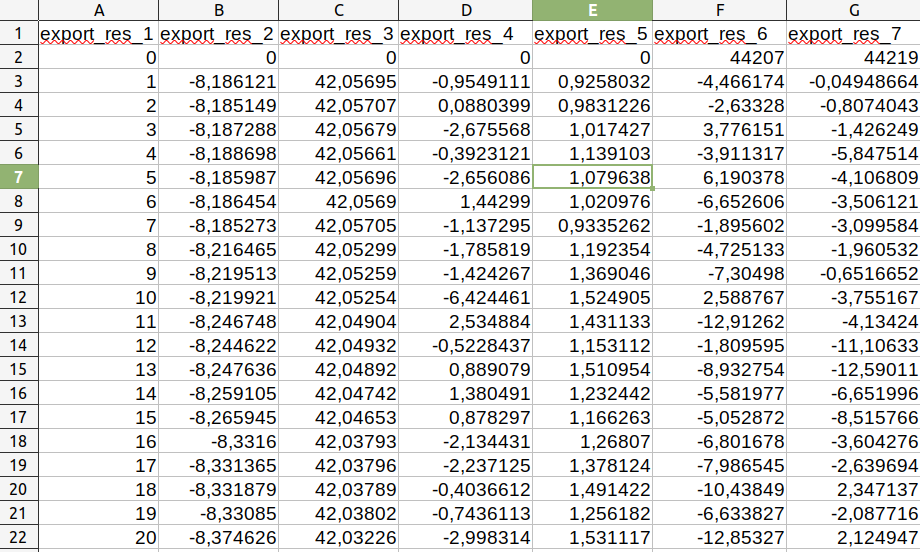
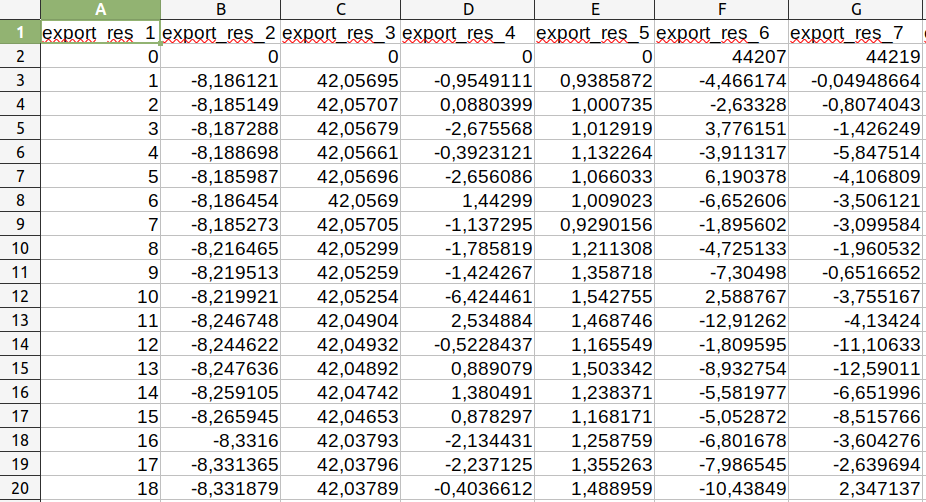
FIRST RUN results:
Export4 (is TS mean Velocity) and Export 5 (is Standard Deviation)
SECOND RUN results:
THIRD RUN results:
Does anyone have any guess about what could be trouble here? I really don’t have any idea whats is the issue ![]()