hello, everyone.
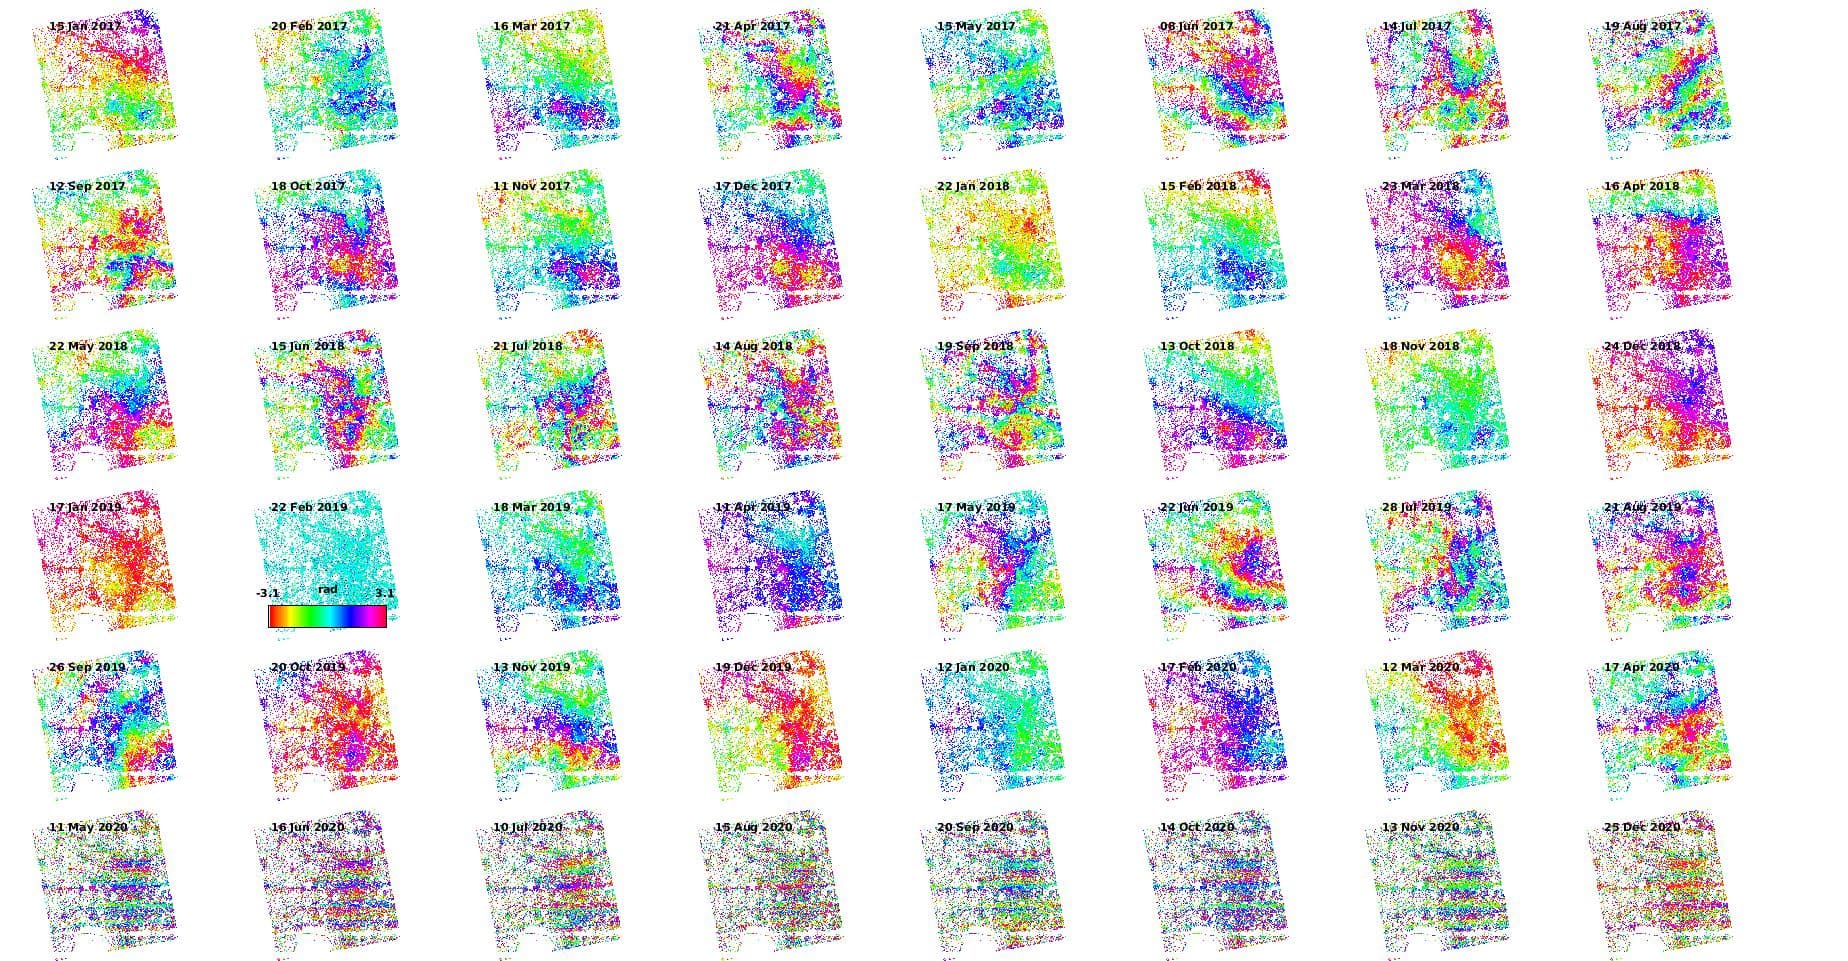
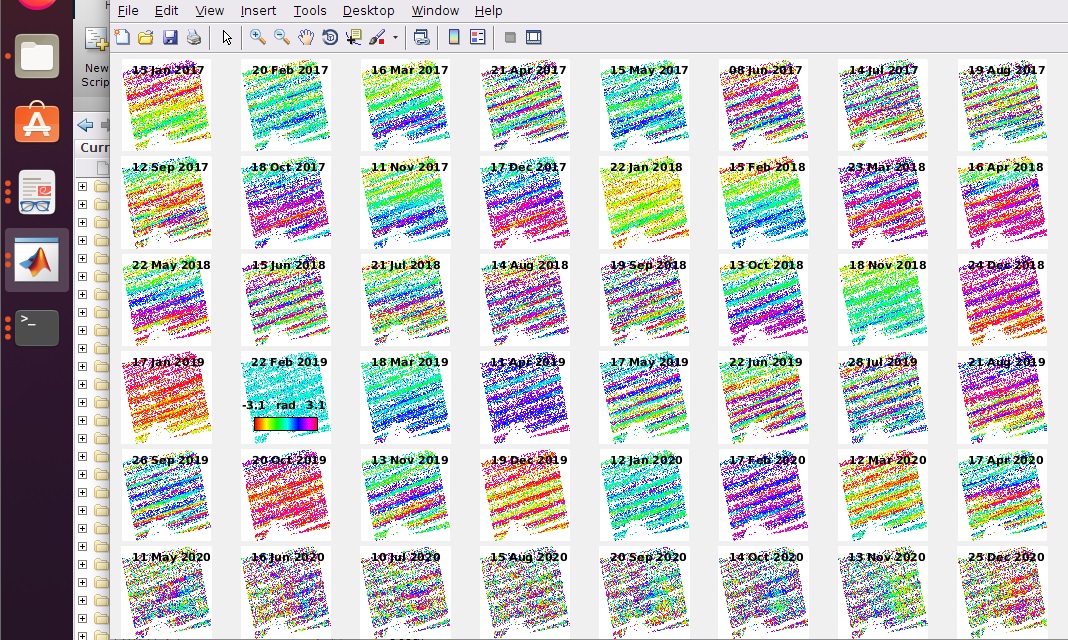
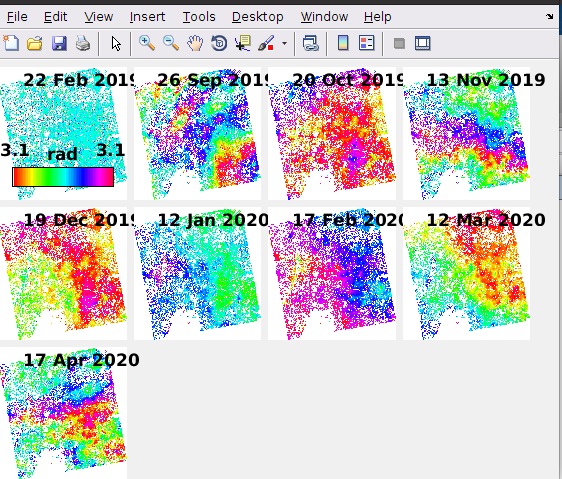
I have used Stamps to conduct a time series analyse. but the unwrap phase (ps_plot(‘u’) looks not good. We can see some like horizontal lines in the last line of wrapped phase. The last line of both unwrapped and wrapped phase seems a sudden phase change.
Do someone know what causes this?
i divide all the pics into 25 patches. And here is the pic of unwrapped phase:
i set the params as follows, and use gacos to reduce atmospheric influence, run “step(6,7)” by three times.
density_rand=10;
weed_standard_dev=1;
weed_time_win=365;
merge_resample_size=100;
unwrap_grid_size=100;
unwrap_time_win=365;
masterdate=‘20190222’;
Because the issue is already there in the wrapped interferograms this looks like a problem with your input data rather than a problem with StaMPS or unwrapping. The unwrapping step is correctly unrwapping what it was given.
Is there anything different about the way those interferograms from 11 May 2020 onwards were run?
Nope, I re-done interferograms from May 2020 to December 2020 with the master 20190222. The result seems the same as before.
My study area is in a plain, there is nealy big terrain changes but small land subsidence.
So i used data from Jan 2017 to December 2020 to conduct a time series analyse. the master is 20190222.
because the large volumn of sar data, so i divide these data to 6 groups. May 2020 to Dec 2020 in the last group.
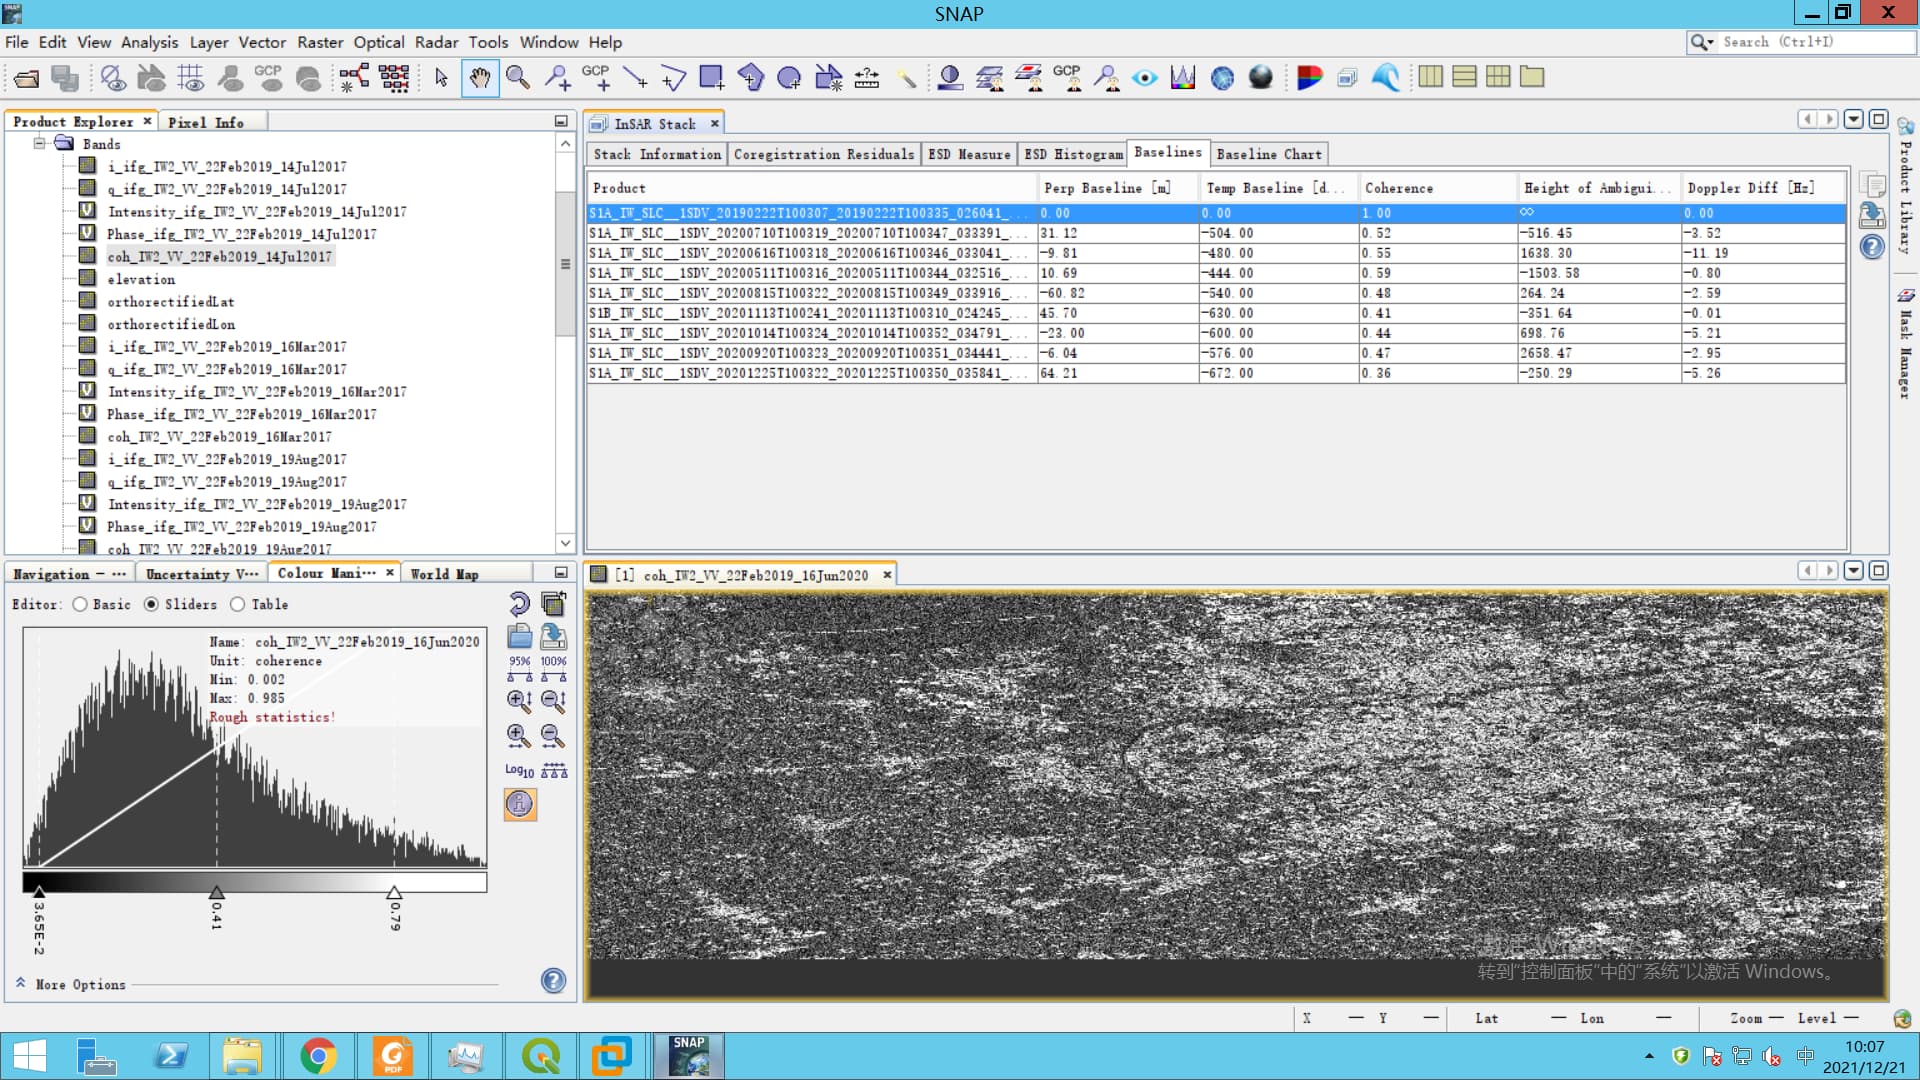
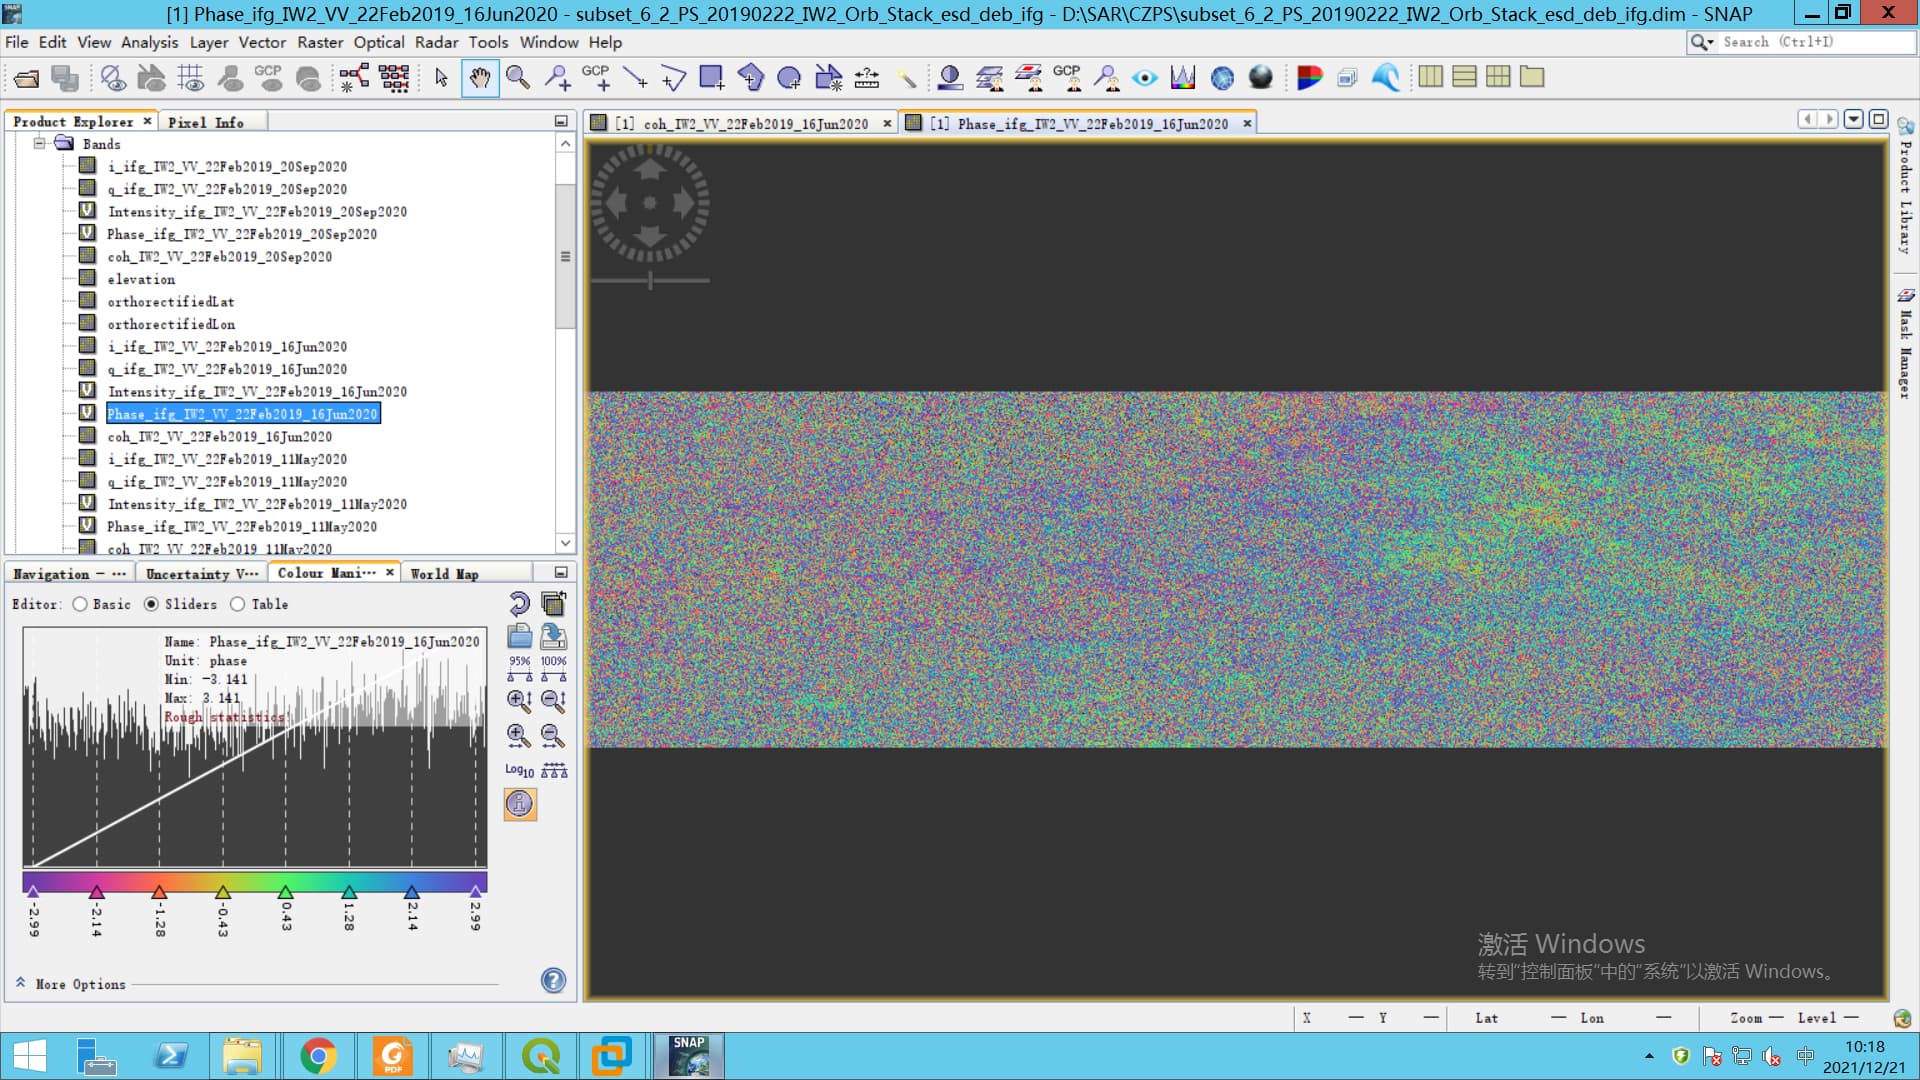
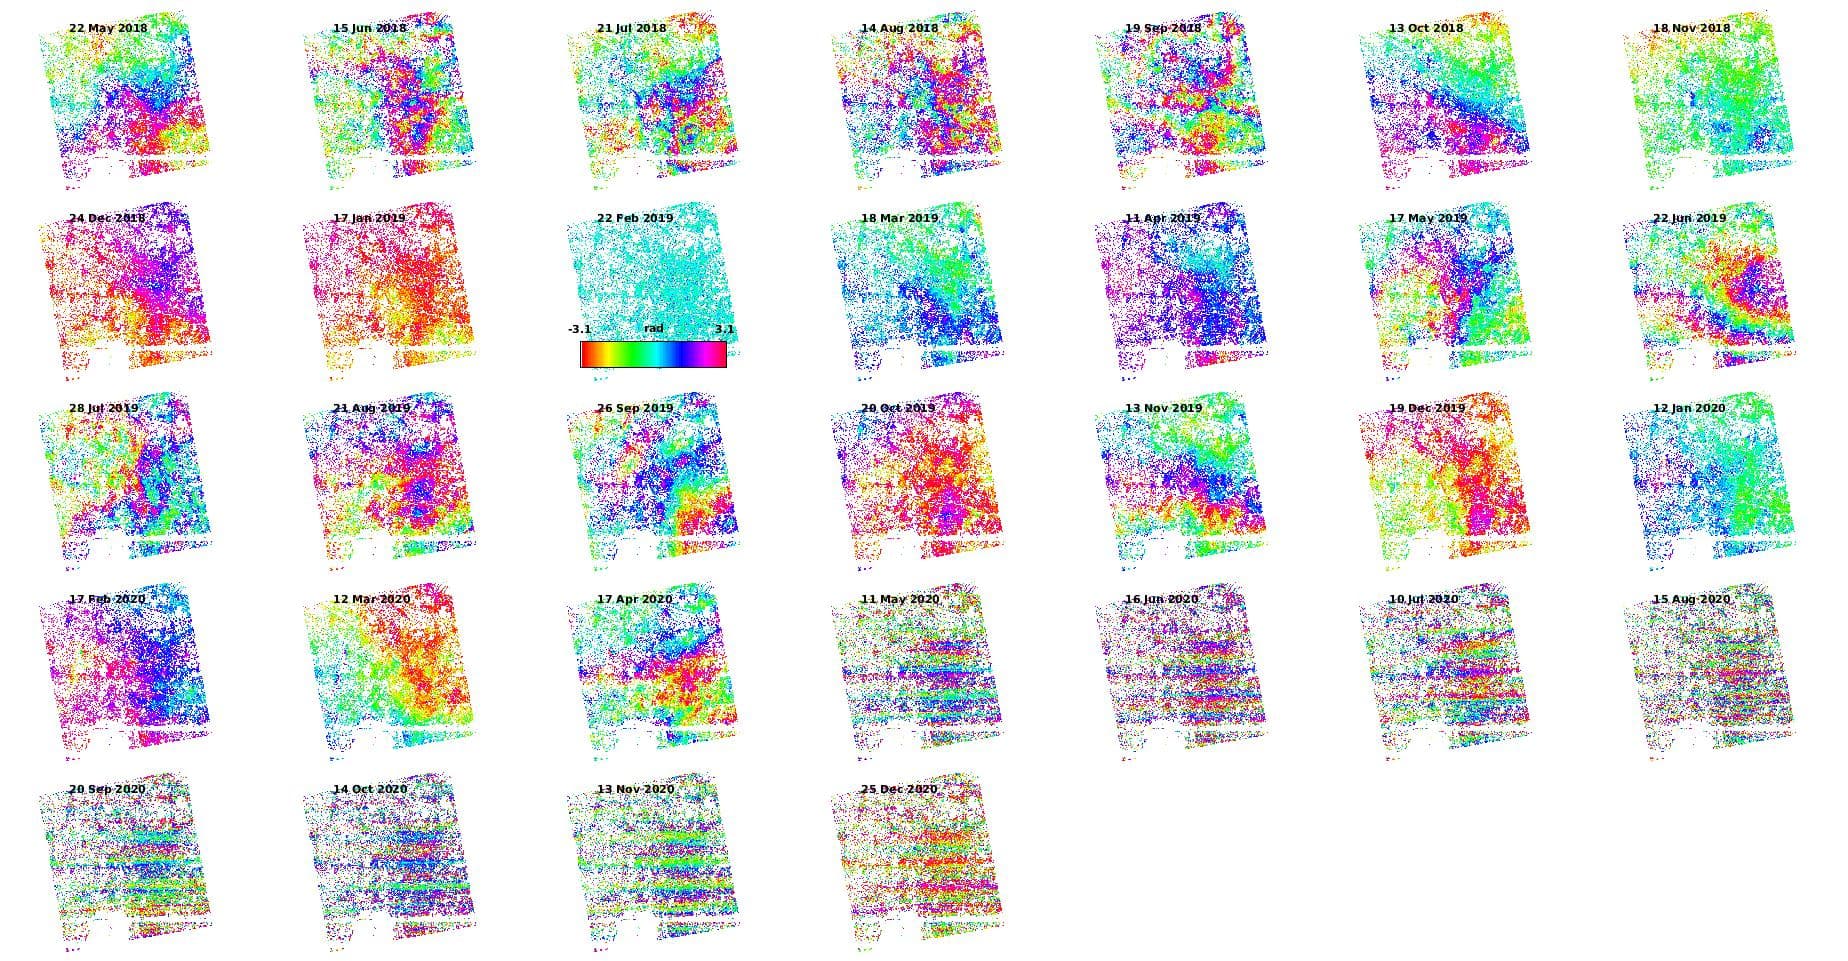
here is the interfegram result of May 2020 to Dec 2020:
the coherence statistics is not that good,but this is because there are much countryside region in my study area.
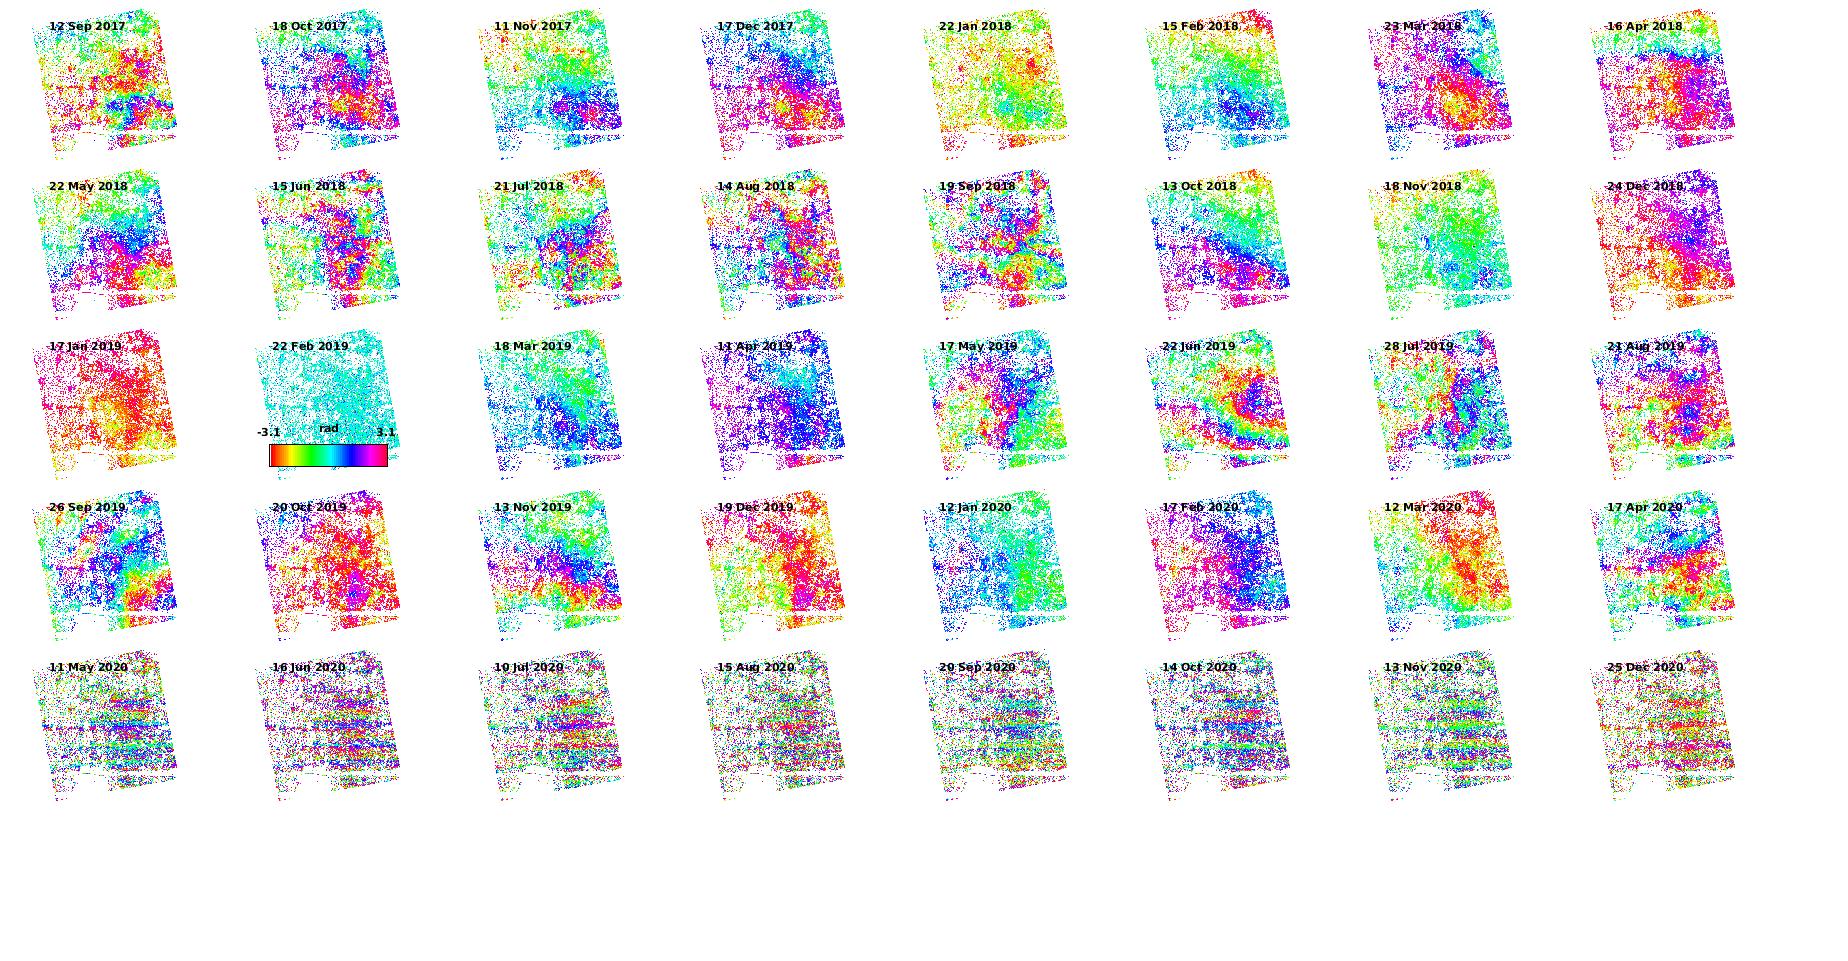
and i checked other interfegrams, Jan 2017 to Aug 2017 with the master 20190222, the result seems similar.
Ok, so all of the last group are affected, but the interferograms look fine when they’re in SNAP.
I don’t know what could be changing the phase of the interferograms in between SNAP and StaMPS.
Do the elevation, Lat and Lon bands look correct?
My only other guess is could it be a problem with patches being re-combined incorrectly, do you split your interferograms up into patches of that size at any time during your processing?
Let us know if you find the answer, I want to know!
Then i run stamps(1,5) by only 1 patch on the master and 47 slaves, ps_plot(‘w’) is wrong again, the result similar to 5*5 patches.
but when i stamps(1,5) by 5*5 patches with a master and 7 slaves (subgroup of the 47 slaves used before), ps_plot(‘w’) looks like this:
I kept parameters stay same in the 47 and 7 slaves tests, so the only difference is the data volume: 48 pics with 8 pics. So i am wondering maybe stamps could not handle too much slaves, 48 slaves is too much ??
I test 32pics with 31 slaves, 48 pics with 47 slaves. The assumption that too large data causes these linear stripes turn out to be wrong. And i have searched in this forum that someone has analyze 52 pics in a time.
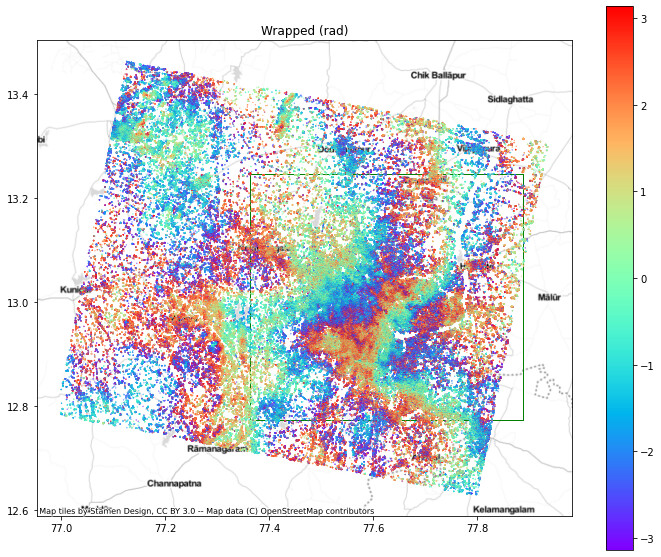
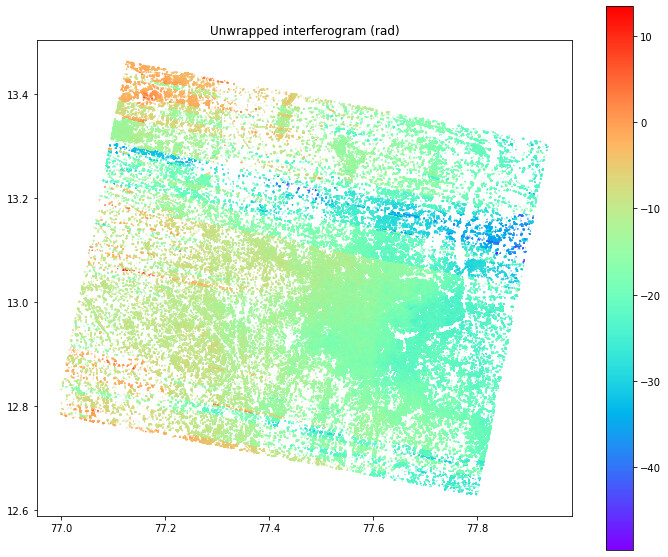
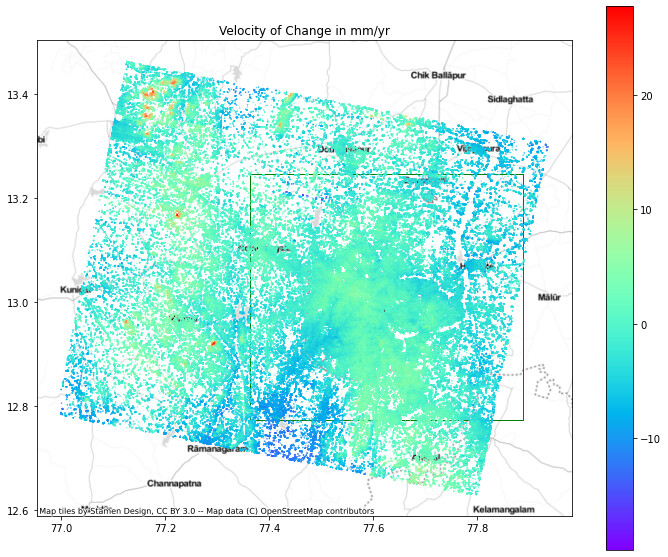
In My case I have done PS processing using 105 scenes. from Apr 2018- oct 2021 . It seems fine with wrapped interferograms but after unwrapping. it is found noisy and patchy but velocity map has no such discontinuity. Can someone please help regarding this issue. for example interferograms are given for 11th Apr 2018. @Snow@eaeo , did you get any clue regarding this @ABraun Sir can you please suggest something regarding this
Wrapped -
Although it’s not showing up in the velocity map you will notice the unwrapping errors if you plot a time series graph.
I’m not sure of the cause/solution but because you have unwrapping errors that don’t seem to be related to this wrapped interferogram I guess that one of more of your other interferograms might be problematic.
Try changing the unwrap_method to 2D, this will mean that each interferogram is unwrapped separately without ‘help’ from the time dimension. This might help you to identify which interferograms cause the problem. Then you can drop those ones or if you really don’t want to drop them try changing the weeding or unwrap_grid_size or unwrap_time_win if that seems appropriate for your location. Then you can switch back to the 3D method.
Not sure if this will fix your problem but that’s what I’d try.