Hi @masoodhp ,
hmm haven’t done this for a very long time, @ABraun or @mdelgado can you have a quick look at it?
Hi @masoodhp ,
hmm haven’t done this for a very long time, @ABraun or @mdelgado can you have a quick look at it?
Thanks for your response.
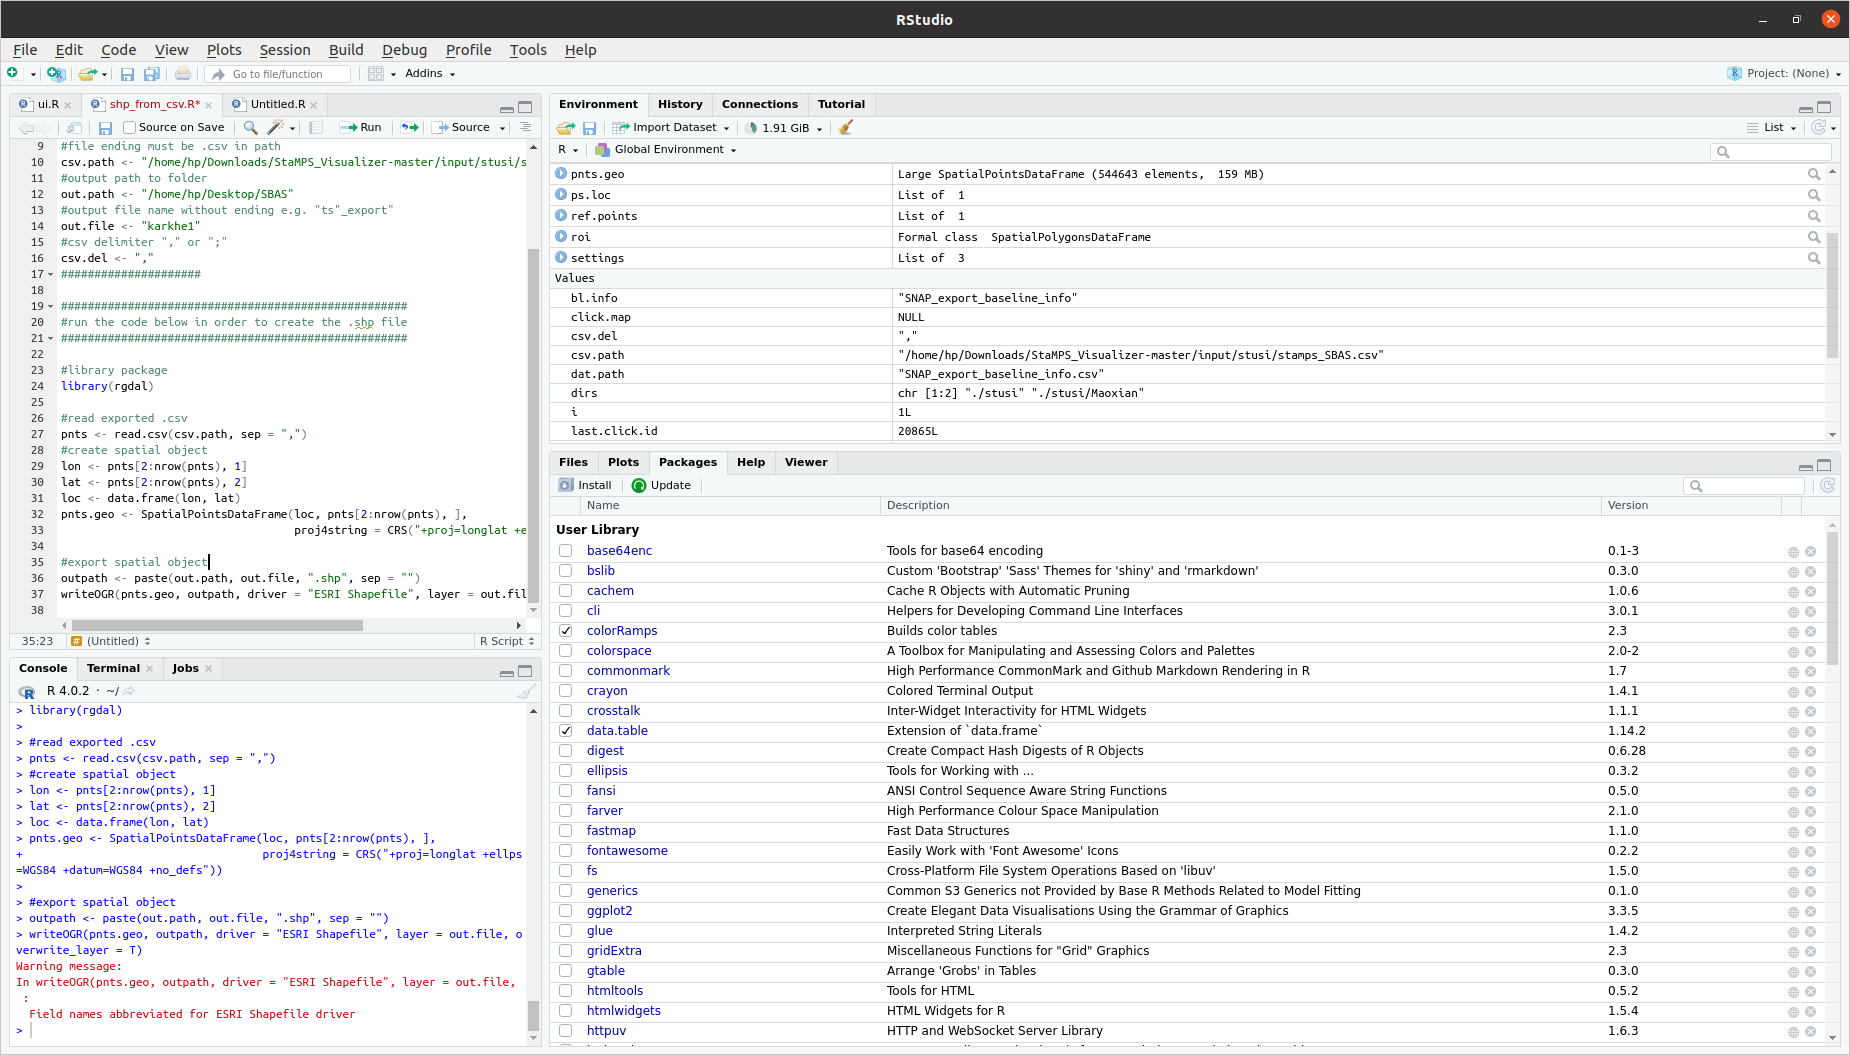
I changed the lines 16 and 27 now I got this error.
@masoodhp this is just a warning, the shapefile was most probably written to disk. ESRI shapefile has its drawbacks, one of it is, that you have a quite limited number of characters which you can use as column headers in the attribute table…the warning is about, that they were shortened automatically during the write process
The problem has been solved following your instructions and installing the latest version of STAMPS-Visualizer. Also, I re-run the whole process, dividing the dataset to further Patches and all works fine. Thank you very much!
Dear @thho ,
I have 5 GPS stations in my Study area. I want to plot these station locations in Stamps_visualizer plot using latitude and longitude ?
Is it possible to plot those stations in the PS_InSAR plot generated by using StaMPS_Visualizer?
hi @suribabu,
the current version of the visualizer supports the import of custom gejson geometries, thus adding a point layer should work out of the box.
In order to make these point also clickable, in order to plot their time series is more complicated and you would have to add some options in the code I guess.
Hey, @Gijs
1- Can you explain how did you manage to combine Asc and Des data, please? I saw your codes on GitHub but I don’t know how to use them.
2- Actually here (StaMPS-Visualizer, SNAP-StaMPS Workflow - #199 by Gijs) you said that “After the reference point you can use the formula: LOS displacement / (cos(radians(incidence_angle)) to convert the LOS displacement to vertical displacement”. So If I want to calculate vertical displacements, no combination is needed, right?
If yes, should I use the velocity column from the CSV file or the displacements of the points?
@thho @ABraun Can you help me with these?
Greetings
Masood
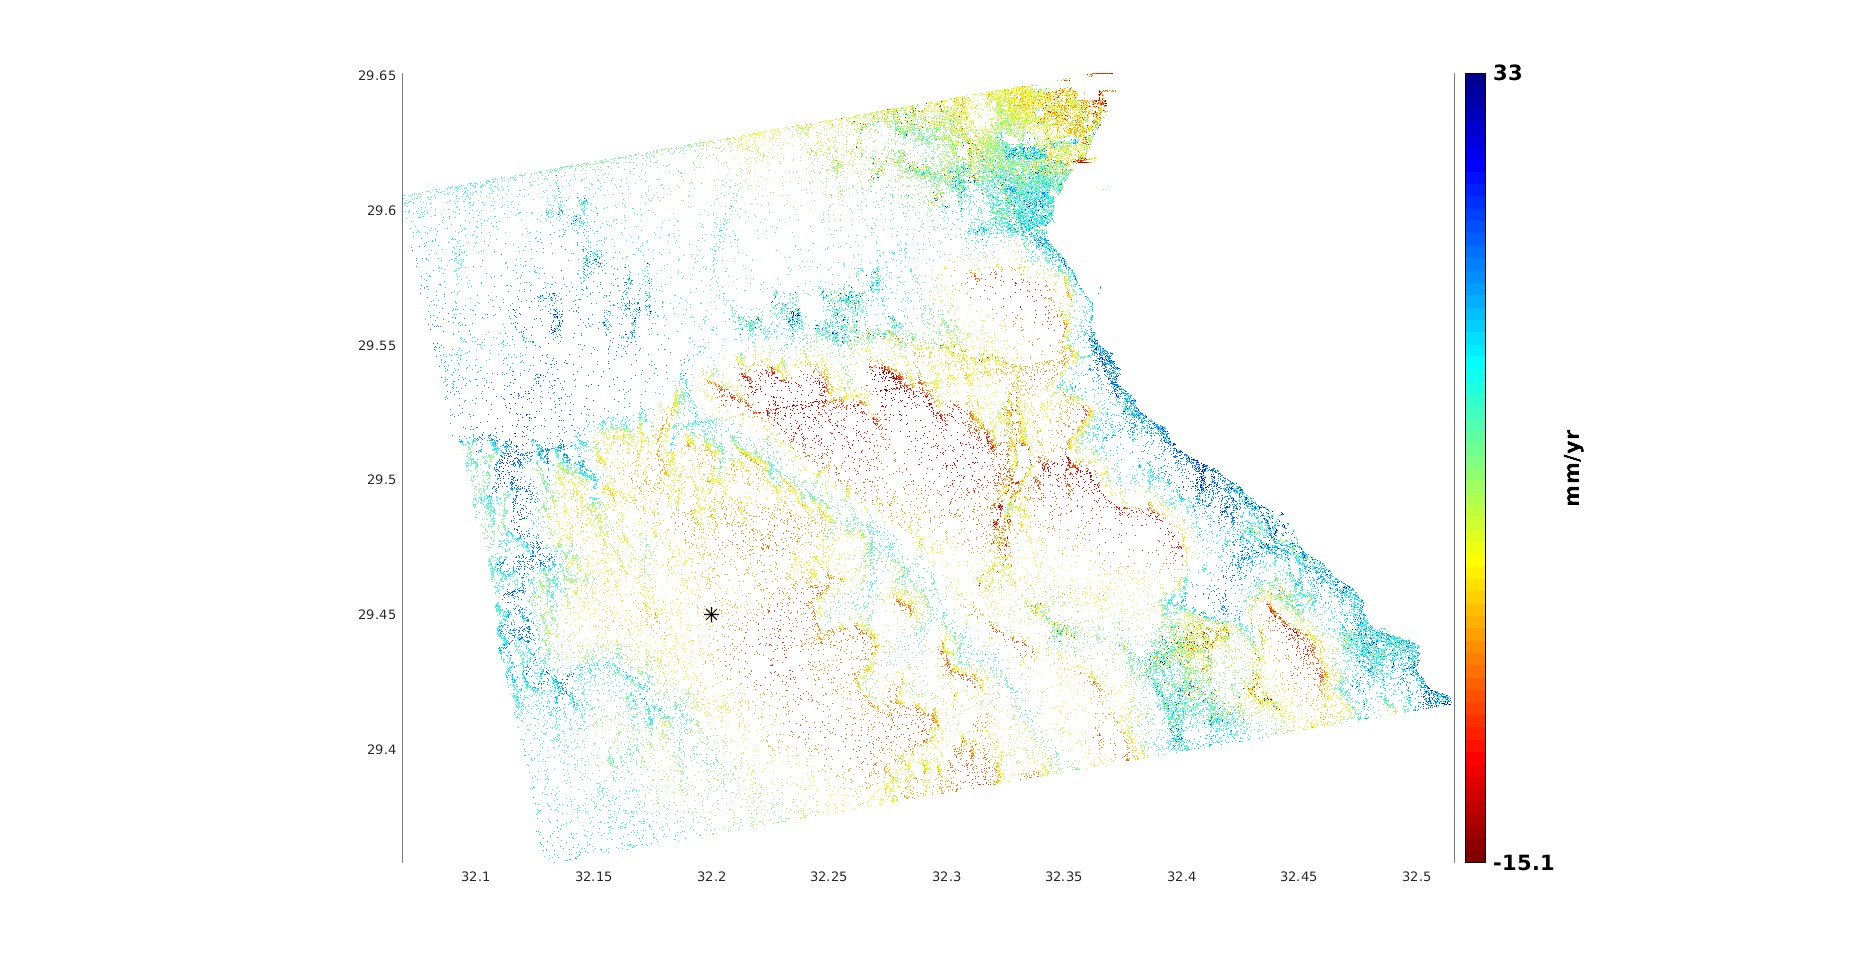
Hello, dear @ABraun . How can I explain this graph? In this case, interpret it for me a little, please.
Sincerely.
This is a typical sime series of deformation extracted from multi-temporal DInSAR techniques (PSI or SBAS). Each blue dot represents the displacement at one time relative to a reference date. The red line is optional and indiaces the overall trend which is negative (decrease of the surface), but the R² of 0.82 indicates that the observed trend is not a perfect line, that means the displacement has phases of acceleration and deceleration.
Thank you, dear @ABraun , but what factors can affect the distribution and trend of blue dots (apart from displacement), can rainfall and groundwater feeding be among these factors?
Two kinds of factors can have an impact:
After assign the longitude, latitude and radius successfully, while importing the CSV file with respect to that particular lat long and radius is giving error, please check it once.
K>> setparm(‘ref_cen’,[72.012 21.630])
SETPARM: ref_centre_lonlat = 72.012 21.63
K>> setparm(‘ref_rad’,1000)
SETPARM: ref_radius = 1000
K>> ps_plot(‘v-do’)
Deramping computed on the fly.
**** z = ax + by+ c
861 ref PS selected
Color Range: -6.20838 to 8.16557 mm/yr
ans =
Figure (1: v-do) with properties:
  Number: 1
    Name: 'v-do'
   Color: [0.9400 0.9400 0.9400]
Position: [680 558 560 420]
   Units: 'pixels'
Show all properties
K>> a new window will open in the new window select a radius and location of the radius center to select the PS to export
load parms.mat;
the 'v-doa' parameter is an example you can change it to your needs
but be sure that you use the same paramters as above in the ps_plot()!
ps_plot(‘v-do’, -1);
load ps_plot_v-do.mat;
lon2_str = cellstr(num2str(lon2));
lat2_str = cellstr(num2str(lat2));
lonlat2_str = strcat(lon2_str, lat2_str);
lonlat_str = strcat(cellstr(num2str(lonlat(:,1))), cellstr(num2str(lonlat(:,2))));
ind = ismember(lonlat_str, lonlat2_str);
disp = ph_disp(ind);
disp_ts = ph_mm(ind,:);
export_res = [lonlat(ind,1) lonlat(ind,2) disp disp_ts];
metarow = [ref_centre_lonlat NaN transpose(day)-1];
k = 0;
export_res = [export_res(1:k,:); metarow; export_res(k+1:end,:)];
export_res = table(export_res);
% you can specify the location and name of the .csv export by renaming the second parameter
writetable(export_res,‘reference_deva.csv’)
Deramping computed on the fly.
**** z = ax + by+ c
861 ref PS selected
savename =
'ps_plot_v-do'
Color Range: to 109 m/yr
Error using keyboard
Unrecognized function or variable ‘lon2’.
Did you mean:
K>> lon2_str = cellstr(num2str(log2));
Error using keyboard
Not enough input arguments.
Dear @thho,
It’s an excellent explanation please update it. If you have already updated the manual please forward the link.
Thank you.
this error appeared after attempting to install the leaflet as required after running the ui.R script
And this error appeared after clicking the run app button
After exporting the data to stamps visualizer when i try to open the csv file in stamps visualizer the stamps visualizer window disappear
This may be a small question but I couldn’t find anything re;avent in the STAMPS manual, what does SM and SB stand for, in terms of LOS mean velocity estimation?
Best post by Thho,
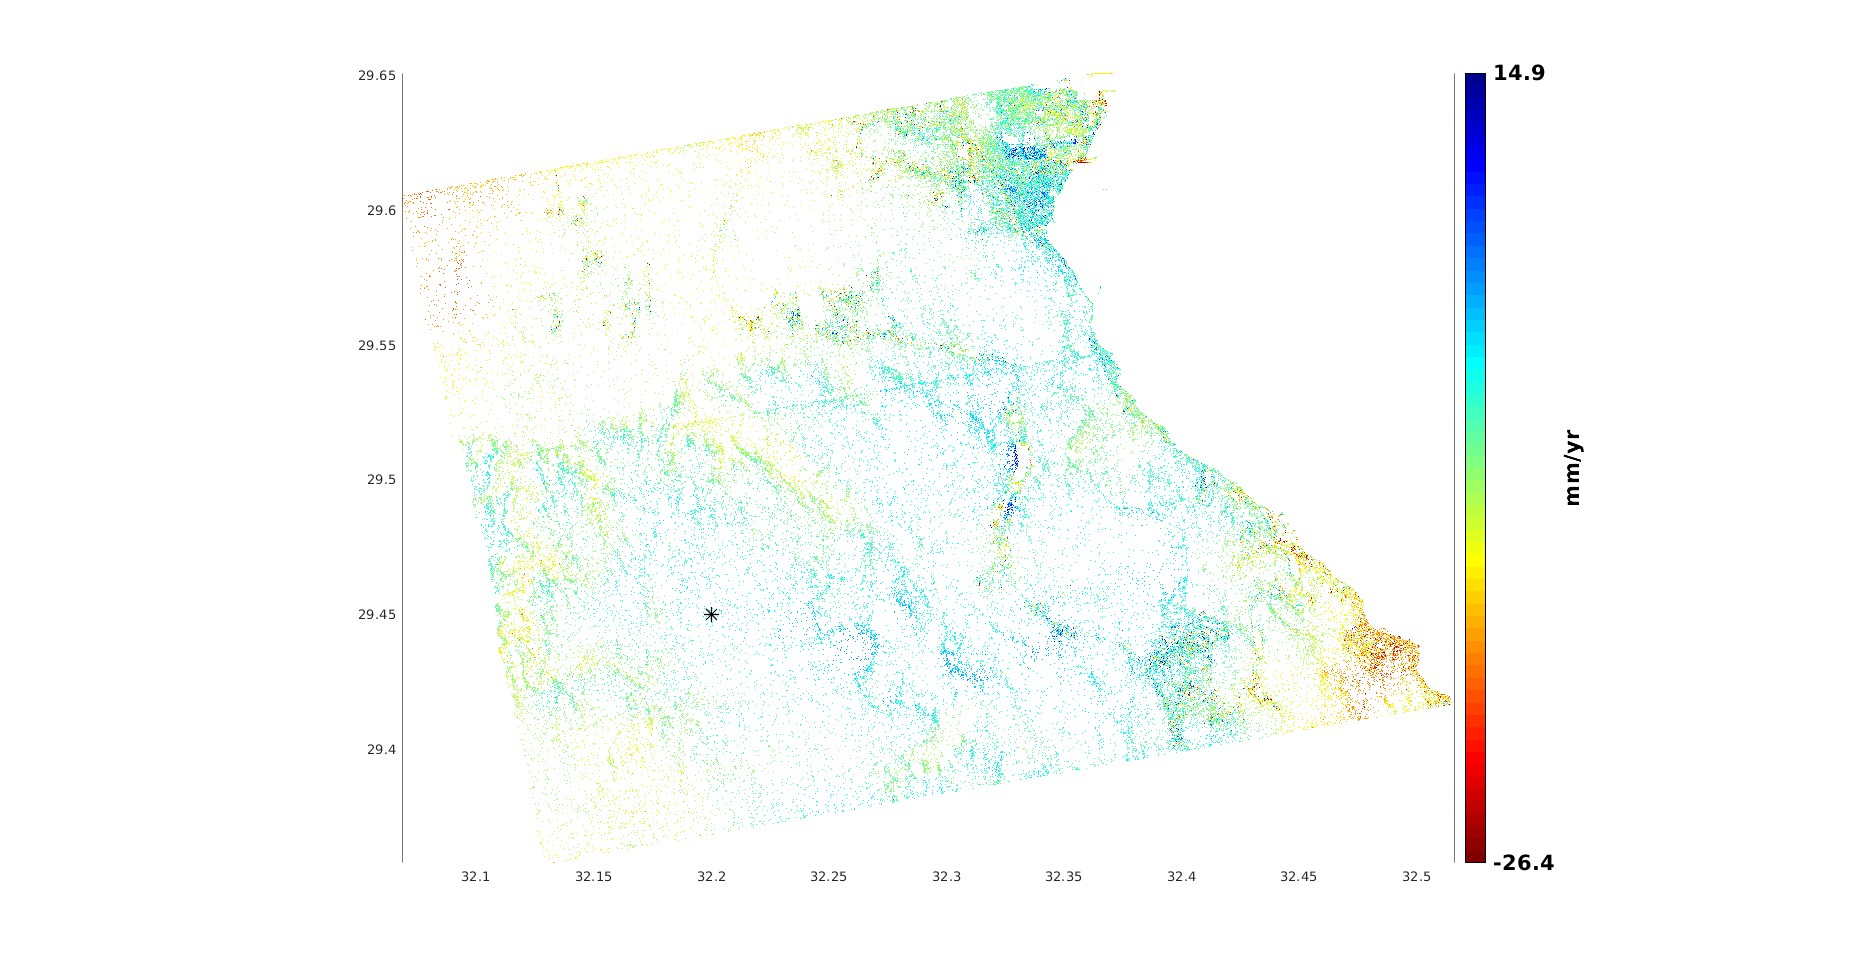
Does the sign of the estimated mean LOS velocity from a time series depend on the master image? or does this question only matter when discussing the sign of values for unwrapped interferogram between two acquisitions ? Sorry this may have been a repeated question but I find different opinions and i wanted to be sure because in my case, the removal of atmospheric contribution has reversed the sign of the estimated velocity completely in some areas, either before or after setting a reference centre
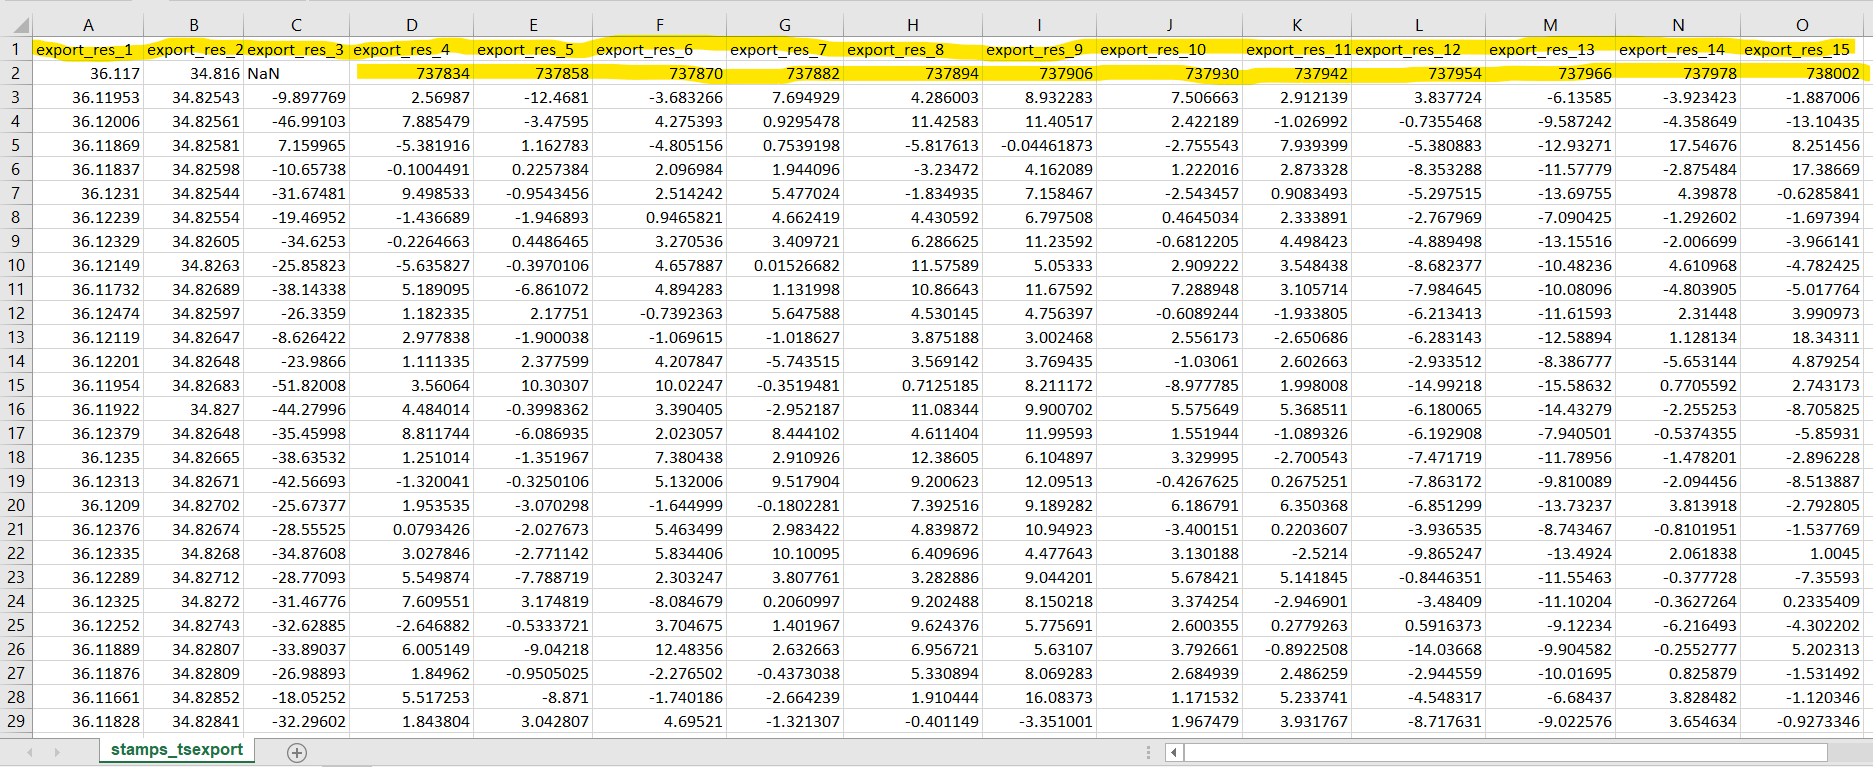
v-do (atmospheric contribution not removed)