Even this is not a SNAP exclusive, I hope it is tolerable to open this thread in this forum, since it is part of the SNAP-StaMPS workflow which is widely discussed here and I hope this will help people to explore their results, made with Sentinel-1 Data, more intuitive.
In this post I was asked by @hchong005 about the data visualization of my results and I said I will provide a beta version of the application I am developing, here it is:
Who wants to use this?
If you want to visualize your StaMPS processed data to explore it in a much more comfortable way (my opinion) as in the Matlab plots, you can use these application.
launch RStudio and open the install_packages.R script in the extracted folder
run the whole script (select all lines in the script and press strg+enter), this will install some packages and take some time
open the ui.R script in the upper left window you find a Run app button, the first time you will be asked if the shiny package should be installed, click yes and wait. The app should launch after that, if this does not happen, quit Rstudio launch it again and hit Run app again.
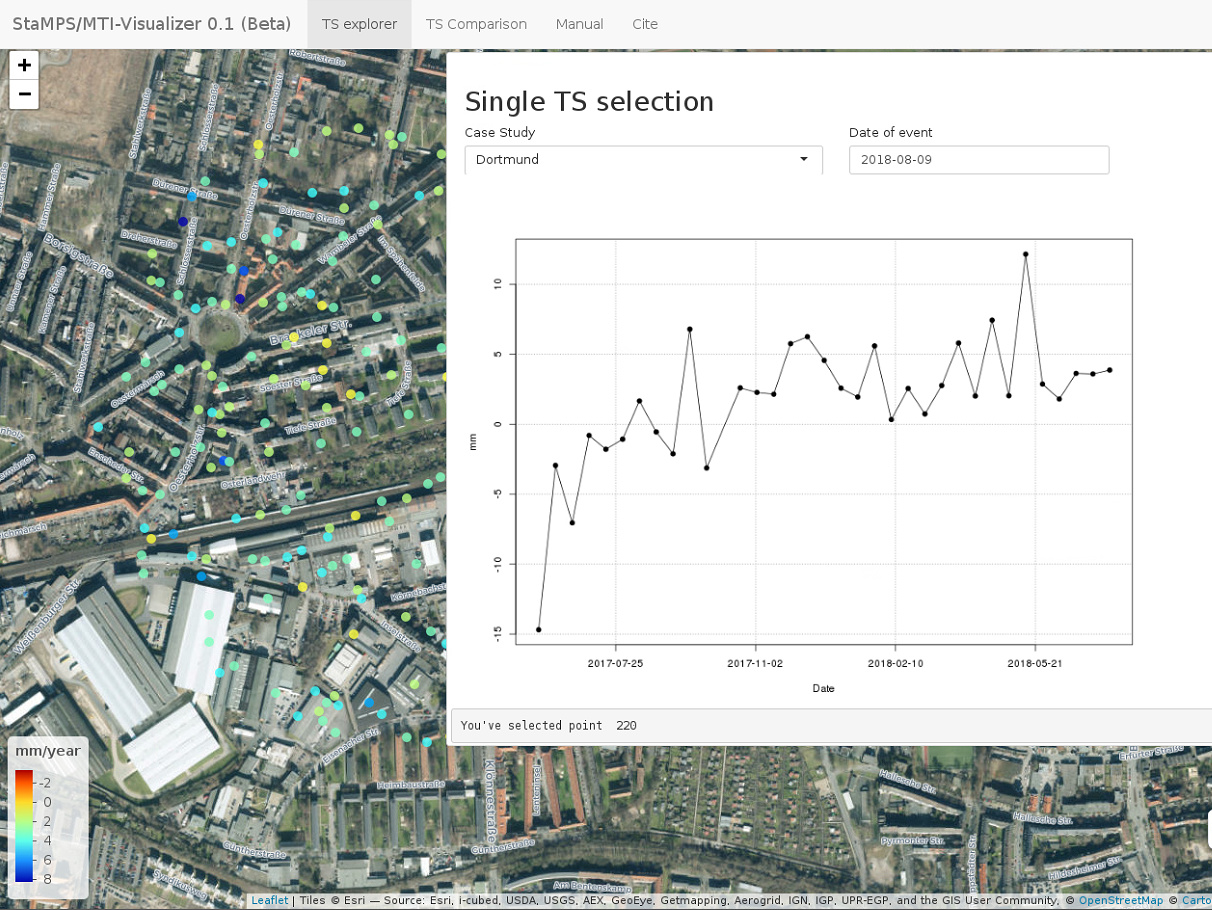
In the opened app you will find four panel options at the top TS explorer, TS comparison, Manual and Cite. Read Cite and Manual to get familiar with the app (its very easy) and have fun exploring the example and your own StaMPS data when imported
Important
If you find bugs or you miss a feature which should be added to the application, tell me about it
I have tried to use it but the shiny package gives errors during the installation. I have tried to use it with R-3.5.0 version (both in CentOS and Windows systems)
Can you specify which R version is the most suitable for using it? Thanks!
when you run it the first time, you might probably again get messages that packages are missing. I installed them with the package manager and it worked.
The script in the manual (can be opened once it runs) gives the instructions on how to proceed in Matlab so that a CSV is exported. The first command is to select an area and a radius (’-ts’). The others can be then executed as a whole but it might be good to keep track of them during the first try to see if they have the desired effect.
The exported CSV is then simply placed in the StaMPS visualizer directory and once you start it again, you can select your data.
Thanks for your helpful advises @ABraun , at the moment I do not have good internet access…
I am looking forward to give access to the version I finally used during my thesis, some minor things have changed. One more hint, if you have trouble with the matlab export, because some of the objects do not have the same length, choose a large radius in order to include all points, export the csv and make a spatial subset in R with a polygon you have prepared in google earth for example. I have to use this workaround during the presentation of SBAS results, because of the much higher density of measurement points.
the colour coding represents the mean velocity, which is calculated during StaMPS processing. In fact, it is the same information you see in a ps-plot but not aggregated. The information is exported from StaMPS, included in the csv table and not calculated afterwards using the time series. I admit, that I tried to figure out how this value is calculated and I came very close but never get the same result…I looked up the Matlab scripts of StaMPS but due to time issues I had to accept the value without knowing the exact way it is calculated.
The colour coding in StaMPS-Visualizer is simply the min max values stretched linear to a Matlab like color ramp of the colorbrewer package…Maybe an optional histogram stretch would be interesting.
Anyway, if you figure out, how the mean velocity is calculated, I would very much appreciate to know about it!
Which column in the csv export is it? I found the first two were lon/lat, then there is NaN, followed by an encoding of the day. Numbers in intervals of 12, so I assume they are somehow representing the number of days from a given reference date?
If you could clarify those numbers I would be really grateful.
The csv table is not that intuitive, I have tried to make it as compact as possible…
[1,1:2] = centre of selection lon lat
[1,3] = Na
[1,4:ncol] = the date in days since 0 of the image, the intervals do not have to be equal, it depends on the image date.
That [1,3] shows a NA value is because, the values beneath it are not part of the time series, these are the mean velocity values, used for colour coding!
[2:nrow, 1:2] Measurement Points lon lat
[2:nrow, 3] mean velocity
[2:nrow, 4:ncol] cumulative displacement values
thank you for clarification. [1,4:ncol] is 736865,736877,7366889… in my case. If I go back this amount of days I end up in the Quarternary
Did I misunderstand something or are my numbers somehow wrong?
@ABraun, you are always welcome! from your screenshot, it looks like you are working in an urban area, SBAS would be very interesting for you, give it a try
thank you for the suggestion! I would really like to test it.
Is mt_prep enough for the newly created directory or do I again need mt_prep_gamma(_snap)?
@ABraun, just note that with SNAP you can only do StaMPS PSI as it is currently now.
In the future I guess that either using my scripts and/or SNAP, we will be able to work with StaMPS SBAS using SNAP as InSAR processor.
The mt_prep script you should run it once all the single master interferograms (for PSI) or multi-master interferograms (for SBAS) are done. And for the moment SNAP only does the single master. There are always work around to solve that, but for the moment they must be implemented.
I am aware of that, but thank you for pointing it out. There is some testing going on at the moment, let @thho know if you are interested to participate.