I would love to… @thho, may I do anything related to the SBAS test that @ABraun has mentioned?
Dear @thho, I used 24 TerraSAR-X images of Barcelona (provided here http://www.intelligence-airbusds.com/en/8262-sample-imagery) and was able to fully process them in matlab. However, when I start the export to CSV, I get an error:
Error using horzcat
Dimensions of arrays being concatenated are not consistent.

Error in Barcelona_2000m_export (line 14)
export_res = [lon2 lat2 disp ts];
Do you have an idea what might have caused it?
Had you by chance used also the snap2stamps package for the PSI data preparation? The current version needs adaptation to the SAR Stripmap datasets, as it was initially thought to the Sentinel-1 TOPSAR, but it is easy to adapt it.
Keep in mind that StaMPS does not correct for the PS geolocation so you will probably get PS shifted, mainly due to PS in high buildings… so you will probably see this in the results, right?
2 Likes
I didn’t adapt snap2stamps for TSX by now as the preprocessing is considerably easier (no orbit, no debursting, no sub-swaths…). It was basically just coregistration, subsetting and export.
Therefore I see no need for automation.
I thought about the shift of the PS but as the StaMPS Visualizer didn’t work by now, I didn’t have the chance to see the PS against a aerial image basemap.
1 Like
Infact, as you have said, the steps reduces for Stripmap, but the graphs may be adapted. I will do it in the next weeks probably.
Dear @ABraun,
this is a common error, which occurs in regions with a high density of measurement points. I was not able to figure out why this is happening in detail. Anyway, I wrote a work around to avoid this included in the current version of the visualizer in the manual within the application, which you can find here:
stamps_visualizer_installation_guide.html (2.8 MB)
stamps_visualizer_20.tar.gz (488.6 KB)
@mdelgado for SBAS processing, I will probably work on this project next month in order to present a stable workflow, I will present it here, but maybe it will take more time, I can not grant it 
5 Likes
thank you very much for providing the latest version.
In my case, the error occurs already in MATLAB before the csv is exported. But never mind, the point density is in case very high. I will try to reduce it in the weeding step.
Dear @ABraun,
sorry, I was a bit imprecise. First when you execute the ps_plot with ts option, you have to select a really large radius which includes all measurement points of your processed data, which results in a really large csv table which you have to export using the usual way, the error will not occur, because no subset is made and all points are used to create the table…therefore no uneven objects can be created. Using this table, the work around in R described in the manual, can be used to subset the points of interest outside Matlab to avoid the error you have been encountered, what you need is an additional polygon which describes the area you are interested in. I suggest to create it in google earth and export it in the .kml format. It is even possible to load the large csv table into StaMPS-Visualizer, but your computer will have to do a lot of rendering to display all points within the csv table…
Hence, you do not have to weed your points.
2 Likes
I see, thank you. I will give it a try.
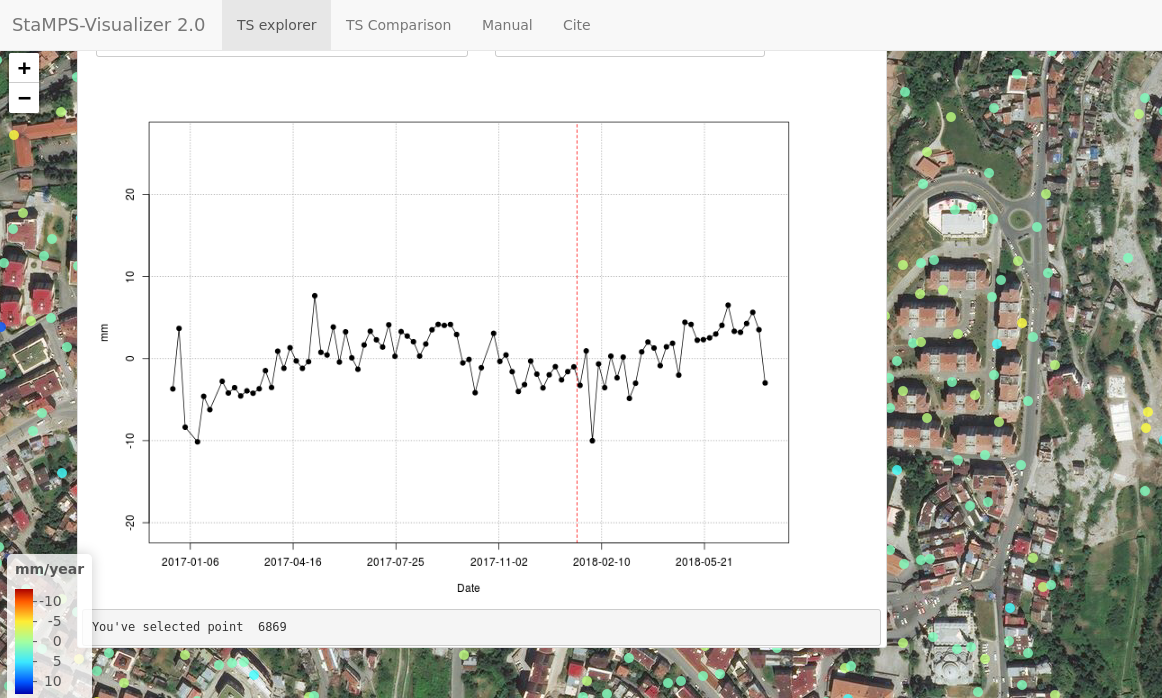
tried StaMPS with 38 ENVISAT ASAR scenes of the Quetta region in Pakistan - resulted in a nice visualization with your tool. Just wanted to share and say thank you again.

6 Likes
Nice result @ABraun
out of pure interest, have you used the R workaround with an external kml file to select the points afterwards or have you been able to export them from matlab as a subset?
Are there further features you would like to have in the app? Once it is put up it is quite easy to add new features. If so, let me know.
1 Like
I have increased the radius and exported all points instead as this seemed the faster solution and the computer could manage to load them all into the CSV.
By now, two things come to my mind:
- An adjustment of the point size. It must be somewhere in the code but it would be a nice feature if it could be changed through the gui. As you see in my example, they are a bit large for this zoom level.
- Instead of connecting the points, a linear or polynomial trend would be interesting. This is realized in the PS Time series viewer plugin in QGIS

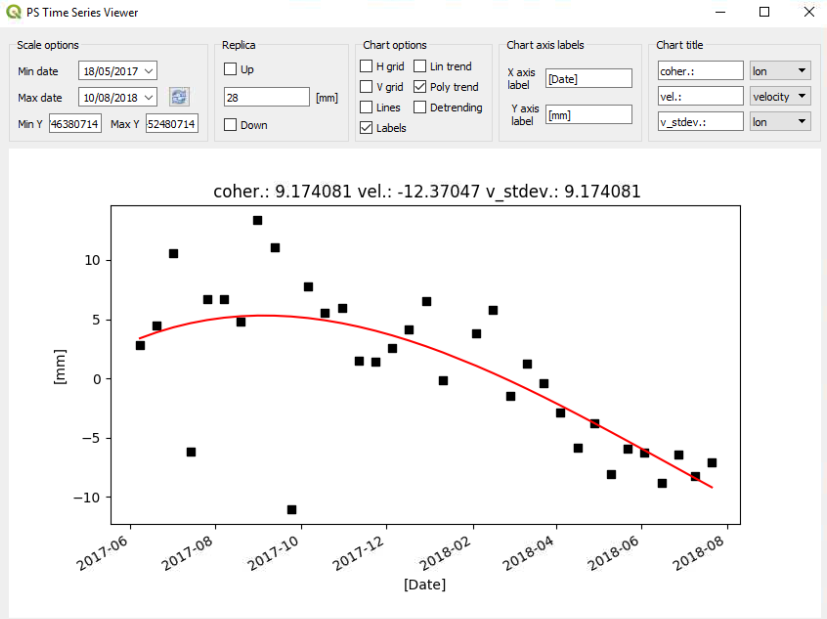
https://plugins.qgis.org/plugins/pstimeseries/
It is written in python, but maybe it gives you nice ideas to adapt.
2 Likes
Dear @ABraun,
I added a Git repository https://github.com/thho/StaMPS_Visualizer to make working on the app more comfortable. The version of the first commit is the version, I distributed here. I will implement your features as soon as possible, I already do have the code, as I used to use second order polynomials for further investigations of the data…but it has to be implemented in the app, which will take me one evening or night or so. There will be some other nice features, stay tuned 
4 Likes
that sounds fantastic.
But don’t feel stressed by my suggestions.
Hello Dear @thho,
Thank you for the visualizer program,
I tried to see my sentinel-1 images PS points results while using this program, but ı got the same error about horzcat even if ı choose radius as 10000 m which contains all of my PS points inside. How can ı fix this problem ? Can you help me please ?
And also 1 more question; normally what ı want to do is; comparing some of my PS points vertical velocities with my levelling results. In my small working area, ı have many PS points and ı can already calculate these PS points vertical velocities and plot them in matlab and exported them in google map. But ı want to compare every single PS point vertical velocity with a levelling point vertical velocity which is close to this PS point according to levelling measurement times. Can ı do this in your program or do you have some suggestions for what ı want to do ?
Thank you so much
Dear @firat,
concerning your error, are you sure that 10000m aka 10km is large enough to really include all points? A subset of this size could be also problematic in atmosphere contribution estimation…just try 100000m aka 100km just to be sure! The error you, @ABraun and also me encountered is somehow strange and hard to replicate without the dataset. Until now, I was not able to figure out how to avoid it. However, using the work around and a really large search are worked for me every time…tell me if the larger search radius does not work either.
To your second question. This is totally possible, but I would have to code some very specific options to do so. But by getting a usable output from Matlab as csv table, you can work with it in R to reach your goal. There are some packages which provide the functions you are looking for, like rgeos, maptools, spatstat, sp. I would love to add this feature to the app, but atm I am to busy with other tasks.
PS atm I do add the smaller features like the one @ABraun talked about, have a look at the github repo. Cheers
1 Like
Dear @thho
Thank you so much for the answer and suggestions,
My area is really a small area and 10 km is very enough to include all points, and it has so many PS points inside like below
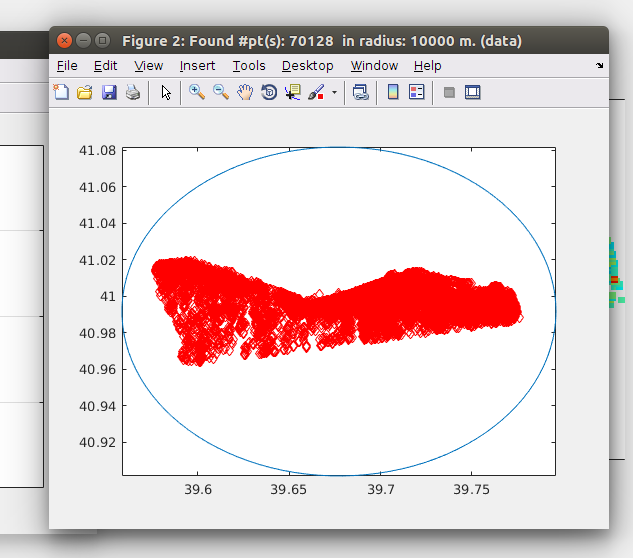
And when ı try it with 100 km radius, again it gives me the same error
Hello Dear @thho and @ABraun
Inside this code " export_res = [lon2 lat2 ver ts]" my ts file is 1x94(number of total interferograms),
I think it should be number of PS points (70128)x94, right ? when ı use ts option with any radius scale (from 100m to 10000 m) , my ts matrix dimensions again are 1x94,
I think, ı have a problem about my ts file, why it is like this and how can ı fix it ? (ı am using StaMPS_4.1b)
Thank you so much
1 Like
indeed, that could be an explanation. I currently do not have access to a matlab license, and can not run the new StaMPS to check for differences of the objects created during ts_plot… :\
Hello Dear @thho
The problem was about the ts file in staMPS_4.1-b which ı installed. ı think ı made a mistake about installing or ı have some bug ı don’t know. But ı try it with old version ‘‘staMPS_v3.3b1’’ again and it worked like below .
Thank you so much for the program again.
1 Like