Dear @firat, nice to see your result and the visualizer working! Try the newer version from github, OSM tiles are now available which could be very helpful for urban areas 
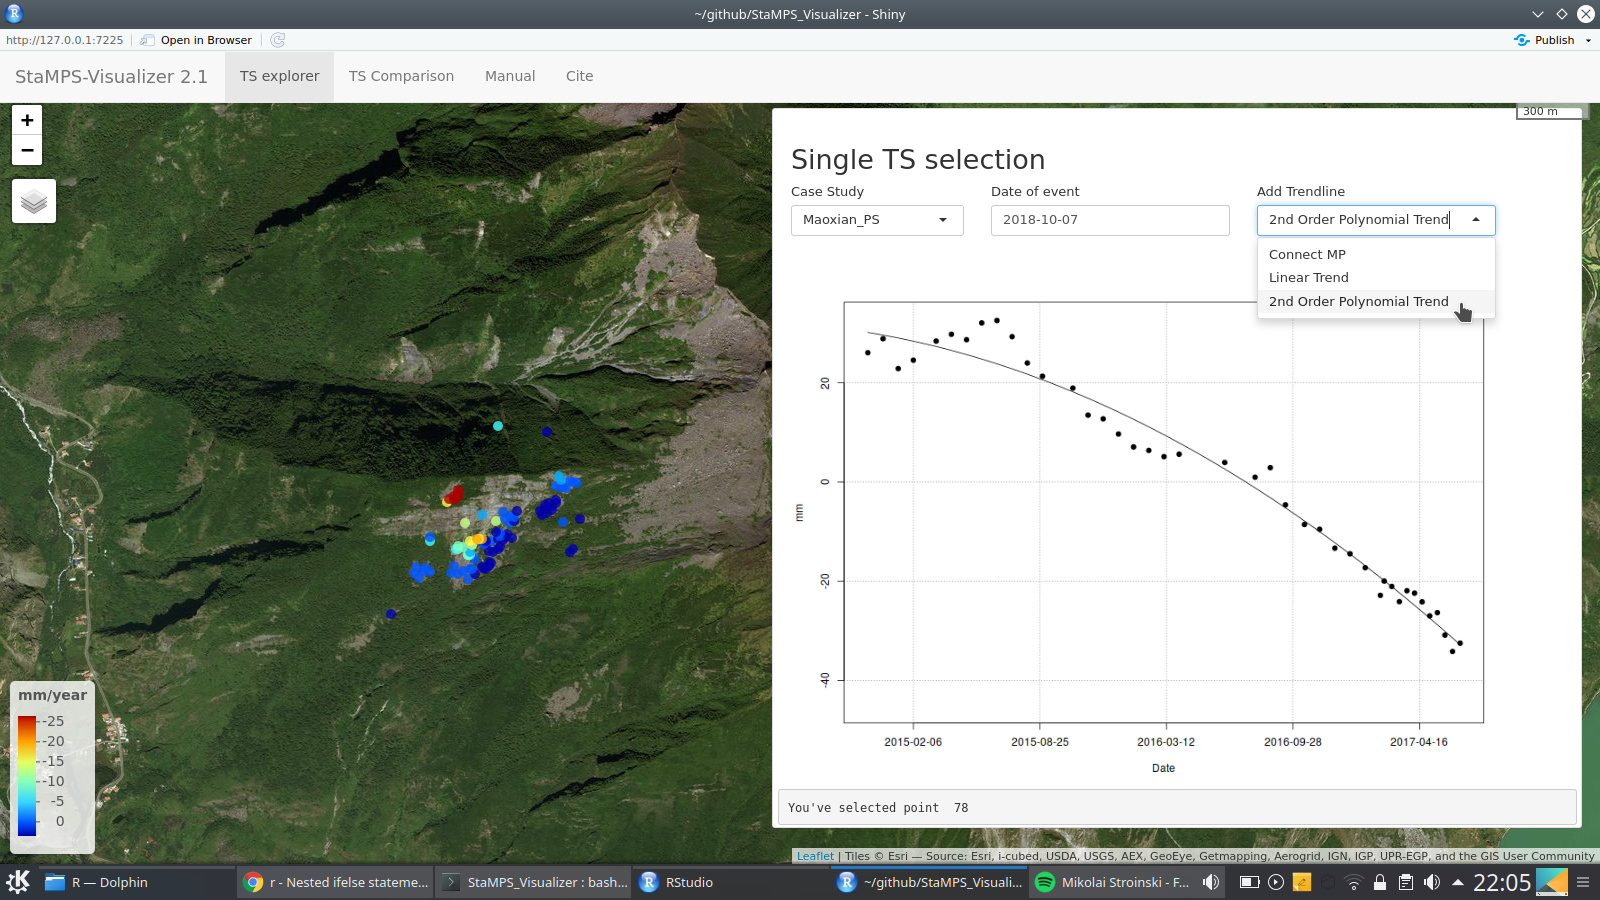
@ABraun, linear and 2nd order polynomial trends are now available for StamPS-Visualizer
4 Likes
that is just great, thank you!

Nice to see and hear you liked it @ABraun, the option to scale the point size is absolutely possible and I have already programmed a slidebarInput for this simple task…but there seems to be a problem or some kind of conflict with the embedding of the css file or the css file itself and the sliderInput…atm the position of the settings and plot panel influences the usability of the slider with it and I was not able to figure it out until now. I will look after it in my next round working on the app. Until then, you are welcome to use the time for more ideas which could be useful within the app.
Hi ABraun, can you tell me how do you export your PS data to be used by that Qgis Plugin?, I have already processed my data via SNAP-Stamps and now I would like to visualize it.
Thank you
It’s a bit tricky but it works.
Basically, you need to export it with the matlab-script demonstrated by ttho in his tool. This gives you a CSV table with coordinates and single values per date. I import this in excel and create an additional header with the date formatted as required by the plugin (D20181017). Once this is done, you can save it as a CSV and import it into QGIS with the “add delimited text” option.
To save RAM, save it as a Shapefile.
This file demonstrates how exactly the attribute table should be formatted to be used in the QGIS plugin: https://gitlab.com/faunalia/ps-speed/tree/master/testdata/shape
It is close to what is exported from Matlab but some adjustments have to be made.
4 Likes
Thank you ABraun, I was quite surprised when I saw that plugin in the repository but I had no idea how it worked and I couldn’t find the documentation, I will try it and see if I can add the extra column automatically, thanks for your help.
Hello @thho, if you want, ı can give you an idea which can be helpful for your program
Adding point optiong for example ? for seing which levelling or GNSS point is close to which PS point.
This can be very helpful for users.
Also if we can add the vertical velocities or coordinates of our levelling or GNSS points, and then if we can compare our terrestirial results with image results like this, it can be so much better.
Dear @firat,
thank you for your suggestion, it is similar to the one you mentioned some weeks earlier and in fact I have started working on it but have to stop, due to the fact, that I have come to a point where I have to expand the whole project and give it more time. The GPS comparison will come sooner or later, atm I am no longer brave enough to make statements about a date, because I have to work on it in my spare time and next to other projects. Anyway, smaller features will be added gradually so feel free and thereby I would like to encourage everybody, to mention features you are missing, I will put them on the list
2 Likes
hi,ABraun, I have export the kml inmy patch folder,but the kml is too large to load in google earth,what should i do?
actually, the script exports a csv file. Are you sure you entered the correct file extension?
A kml is only needed when you want to subset your data as described here: StaMPS-Visualizer, SNAP-StaMPS Workflow
i means when i finish the step “output to google earth”,the kml is too large
this is not related to the StaMPS-Visualizer then, but you find answers here:
oh , i want to use Stamps-visualizer, but dont know where to start with ,my plotform is windows can i finish the visualier under windows,can you give me some advice
Although I still believe that the whole StaMPS workflow only runs without errors under Linux, it should be possible to use the Visualizer in Windows to display the results. But note that first you will have to produce correct displacements with StaMPS (until step 7 at least)
You need to export the results from Matlab first, the visualizer itself can then be used to display the results. Please start with the list in the first post and install R and RStudio to run the scripts provided there. Once the Visualizer runs, you can find a detailled description on how to export the data as CSV from Matlab to be analyzed in this software.
1 Like
i got it ,but when i run the export_csv in matlab,:
ps_plot(‘v-do’, ‘ts’);
load parms.mat;
ps_plot(‘v-do’, -1);
load ps_plot_v-do.mat
lon2_str = cellstr(num2str(lon2));
lat2_str = cellstr(num2str(lat2));
lonlat2_str = strcat(lon2_str, lat2_str);
lonlat_str = strcat(cellstr(num2str(lonlat(:,1))), cellstr(num2str(lonlat(:,2))));
ind = ismember(lonlat_str, lonlat2_str);
disp = ph_disp(ind);
export_res = [lon2 lat2 disp ts];
metarow = [ref_centre_lonlat NaN transpose(day)-1];
k = 0;
export_res = [export_res(1:k,:); metarow; export_res(k+1:end,:)];
export_res = table(export_res);
writetable(export_res,‘stamps_tsexport.csv’)
after the ps_plot(‘v-do’,‘ts’);
do i need to select point in the figure
and i select a point in the window , and go ahead
but when i got to’ export_res = [lon2 lat2 disp ts];’
the error occurs: beacaue the matrix in the bracket is not consist with each other;
for examplre:
the lon2:1041
the lat2:1041
the disp:1041
but the ts:110
so when i go next:export_res = [lon2 lat2 disp ts];
an error occurs beacuae the matrix is not consist with each other
how to deal with it
1 Like
hard to guess. But it is important that you run
ps_plot(‘v-do’, ‘ts’)
first, then select a point to create the plots.
Then execute the rest of the script (beginning with load parms.mat)
Maybe @thho has an idea.
Good job creating the map by the way 
1 Like
dear @zhuhaxixiong,
first of all, your steps look good to me, creating the plot, selecting a point with a search radius for the PS of interest and then continue with the load parms.mat is the right way to use the script I wrote.
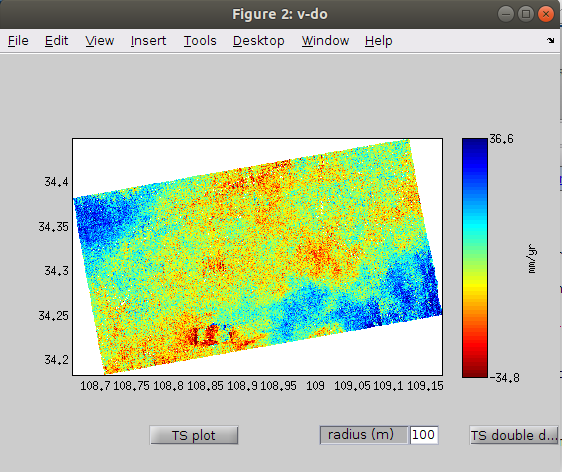
Concerning your problem, my first guess is, that you have a very very high density of PS/DS. However, this sometimes leads to some unmatching issues reported earlier in this topic. To avoid this, select a very large search radius like 10000m to select all points and subset this later on, all these steps and the subsetting are documented in the app, you could look them up in the manual tab using the example version here if you have not installed R, Rstudio and run the app, which you should do anyway in order to use it.
What is a bit suspicious is, that the difference between the length of all variables to the ts variable is very large…If this does not fix the problem, could you provide a screenshot of your matlab window, showing the environment with our variables produced by StaMPS and my export script on the right hand side? This would be helpful, atm I do not have access to a matlab license and have not worked with the new StamPS 4.x maybe some details have changed in this part, but I doubt that. Anyway, a screenshot with the variables created until the export step of the csv table would be helpful.
1 Like
when i reduce the radius to smaller,the number of ps point get to four,but the same error ocurrs again,
the matrix export_res is consist of four matrix:lon2 lat2 disp and ts,and the first three matrix is a n1 matrix(n is the number of ps point ),but the ts is the time serise,in my enviroment ,there are 10 different time slc to process,so the division of ts is 101,so i think this may be the error