SNAP - StaMPS Workflow Documentation

Dear all,

I have recently started to work with PSI using the SNAP-StaMPS processing chain.

Even though our team does have lots of prior experience in (radar) remote sensing, I have to admit that it was quite an effort to get started with StaMPS from scratch. I figured that this is mainly due to a lack of documentation of (i) the whole workflow and (ii) the parameter settings of StaMPS. Existing information is somewhat scattered across various manuals, tutorials, forum posts, journal and conference papers. Please do not misunderstand this as criticism of the software or its authors. Being a heavy R user myself, I know that writing comprehensive documentation is tedious, and considering all possible problems/errors that might occur on various operating systems is almost impossible. Software development does require substantial resources, which are rare in many cases.

In an attempt to provide a solution-orientated approach to cope with certain initial difficulties also others might face when exploring StaMPS, I wanted to share my insights from the last couple of months. Inspired by the very helpful SNAP-StaMPS Workflow by @thho I decided to document my experiences for future reference.

I have therefore started to work on a general documentation of the whole SNAP-StaMPS-Workflow, from installation instructions to export and plotting.

By now, I have finished the first two chapters:

More to follow, including:

  • StaMPS main processing chain: parameters, sensible default settings for selected applications (e.g. infrastructure monitoring, landslide monitoring) + example;
  • TRAIN;
  • Data export (what and how to export) and visualization (running viStaMPS under Ubuntu; Shiny: StaMPS-Visualizer);
  • Transformation of LOS displacements to vertical and horizontal components using ascending and descending orbits.

Should anybody want to share his or her wisdom - contributions are welcomed (e.g. via merge request).

Kudos to the official documentation, this forum and its many contributors (most notably by @thho, @ABraun, @mdelgado, among others) and the MAINSAR Google Group.

Further Reading:

Best regards,
M

21 Likes

@m477h145 nice work! It was time someone did an example with the snap2stamps package in a format like your blog.

1 Like

this is just great. I see lots of confusion and outdated information in the existing topics on StaMPS so your work comes to a very suitable time! I will have a look at it later and comment here, if necessary.
Thank you for your efforts!

1 Like

Thank you both for the positive feedback!

Confusion and outdated information were the main reasons why I decided to come up with this in the first place. I will continue to work on it, next steps are a full StaMPS workflow walkthrough (steps 1-8) and a solution for extracting the vertical component from the LOS displacements.

I actually started the process also from scratch a few weeks and had the same conclusions about the documentation. It was quite the effort to get started, so that you are creating this workflow is fantastic!
Thanks so much!

When you said so… you mean the equations to remove the ambiguity between North-South, East-West components? Because initially I thought vertical/horizontal decomposition from LOS, which can be found in literature, but then I have realized it was written horizontal component.

Surely a good documentation is needed to help people not to get lost . Good initiative!

I want just to point that I am working on the evolution of the snap2stamps scripts, so you will need to update the blog in few weeks from now to keep it up to date. So do not loose the track! :wink:

Please check this on your blog: https://gitlab.com/Rexthor/gis-blog/blob/master/Documentation/StaMPS-2_Workflow.md

4.1 Step 1: load PS candidates

Load the PS candidates selected via mt_prep_gamma_snap
Please note that mt_prep_gamma_snap is not used inside matlab to run stamps(1,1) it is something like ps_load_initial_gamma

mt_prep_gamma_snap was the obsolete script which new version is the mt_prep_snap . Please modify!!

@mdelgado Thanks for your feedback. You are right, what I meant was vertical/horizontal decomposition (as mentioned in the OP), and it should of course read vertical displacement. I corrected that in the post (#4).

I’ll be happy to update the snap2stamps part, glad to hear that you are actively working on that :slight_smile:

I also updated the mt_prep_snap section. Thanks for pointing that out. I had corrected that part when I prepared the blog post but forgot to change the markdown accordingly.

In such a case, for that part you can find reference, formulas and pictures on my last paper published together with Michael Foumelis and Prof. Andy Hooper : Remote Sensing | Free Full-Text | Measuring Urban Subsidence in the Rome Metropolitan Area (Italy) with Sentinel-1 SNAP-StaMPS Persistent Scatterer Interferometry on the Section 2.2.3. Post-Processing .

I hope this helps

Hallo!
I have recently started to work SNAP too.
Since I’ll need to process S1 data from SNAP TO STAMPS I would like to practice before getting into my case study.
I have the possibility to process about 50 images from COSMO SKY-MED, is it possible to follow the same workflow?

thank you for sharing this info.

F.

2 Likes

Dear Matthias,

your first 2 blogs have helped me a lot, especially with installing on linux since i am a new linux user.
i dont want to haste you but are you planning on getting more parts out? the community would highly apreciate it!

  • also in blog 1 you note the use of the make command to install stamps before the make library is installed, maybe switch this around. i also needed the build essential G++ library earlier than noted.

Edit: i just noticed the gitlab link, the information is already farther there than on the blog, so for anyone who missed extra information for after snap2stamps go to the gitlab markdown.

Thanks for your efforts!

I am planning to. But not yet ready

Dear @Gijs,

thanks for pointing that out, I will fix that asap.

Yes, I intend to add additional parts. Given the wealth of different parameters in StaMPS and the effort needed to fully understand and describe them in a concise way (i.e. so that the result is actually helpful for an interested audience) requires some time.

I will post any update in this thread.

Dear all,

I have updated the SNAP-StaMPS-TRAIN workflow on my GitLab. A blog post on gis-blog.com will follow soon.

My documentation now covers the full processing chain, including installation and setup, pre-processing as well as StaMPS and TRAIN processing.

I have included a documentation of all stamps parameters as well as some generic recommendations based settings used in existing literature, which I think is helpful as a first basic reference. I am under the impression that many people (including me) starting to use StaMPS are totally overwhelmed by the large number of different parameter settings available in StaMPS.

Please provide feedback and report errors, or make change requests.

Having finished this major documentation effort, I am currently working on contributing to StaMPS-Visualizer by @thho (I have already added LOESS smoothing of time series as a trendline option, more to follow). Conversion of LoS to up/down and E/W displacement and some post-processing scripts (all implemented in R) are basically done, but still need refactoring, some polishing and further testing.

5 Likes

I had already finished my github from my thesis before you updated your blog post. Your posts really helped getting me started, thank you!

I was working on some usable conversion scripts aswell but stopped since in have finished my thesis and will no longer be working in the InSAR data field. you can find my raw readme, thesis and scripts in my github. maybe you find something usefull to add to your incredible documentation. An LOS conversion implemented within the visualizer would indeed be awesome, for areas with alot of points the visualizer is not usable though, i eventually used qgis.

2 Likes


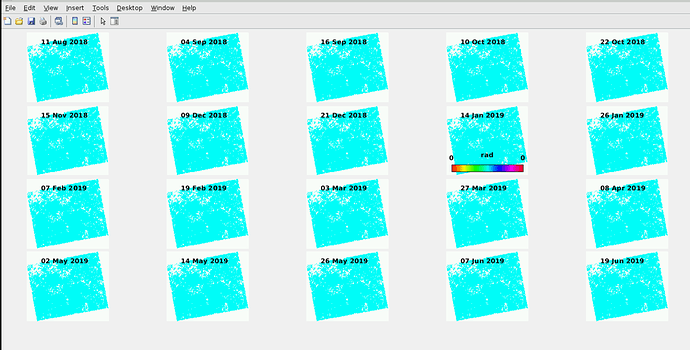
I did everything mentioned in the manual and I got some correct results as well. but now I am getting everything 0. what may be the reason ?

Thanks

Have you checked thr interferograms in SNAP?

Yes, the Interferogram looks fine.


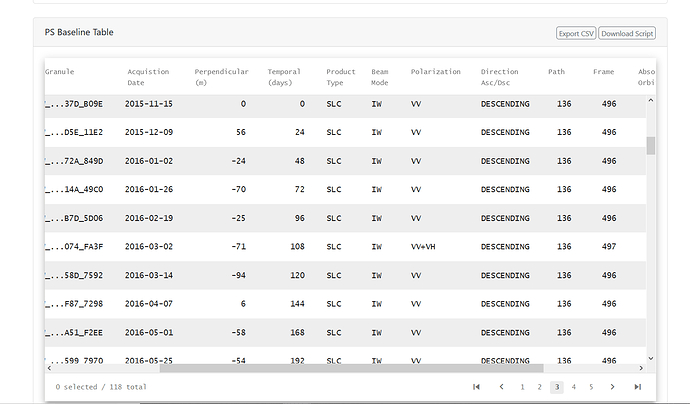
Can I use images from different frames for PS analysis.

Eg. here Frame no .496 and 497.


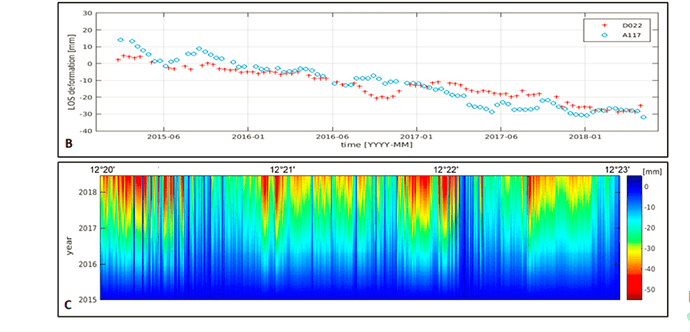
could you share how to produce this picture?