StaMPS-Visualizer, SNAP-StaMPS Workflow

This is noted. Thank you!

cannot read workspace version 3 written by R 3.6.3; need R 3.5.0 or newer
This error shows up after pressing the run-app button

EDIT: problem solved after Re-installing a newer version of R: R4,2,2 and uninstalling then Re-installing R Studio entirely with all of its packages

I do have a trouble exporting from Matlab to Google Earth. I can only export the PS points from the Mean LOS velocity map and I cannot export the scale, besides, the color range is different from what was plotted on Matlab

@ABraun

is it possible to export baseline information from matlab into a csv file to be readable by stamps visualizer?

yes, StaMPS only exports the PS, but not the legend.

Hi That is really great that you managed to get the output. I am trying so hard to figure out my problem. For one of my master’s modules, I am trying to conduct a PSI analysis in Austria. I have done the analysis but I cant figure out how to get the required output to visualize. Really appreciate if someone could point out what I am doing wrong.
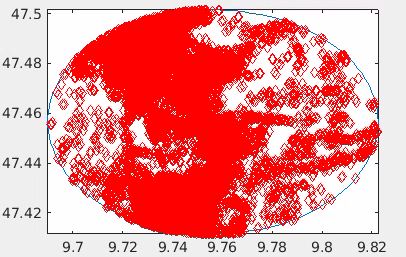
Following are the selected output with 5km radius
selected points

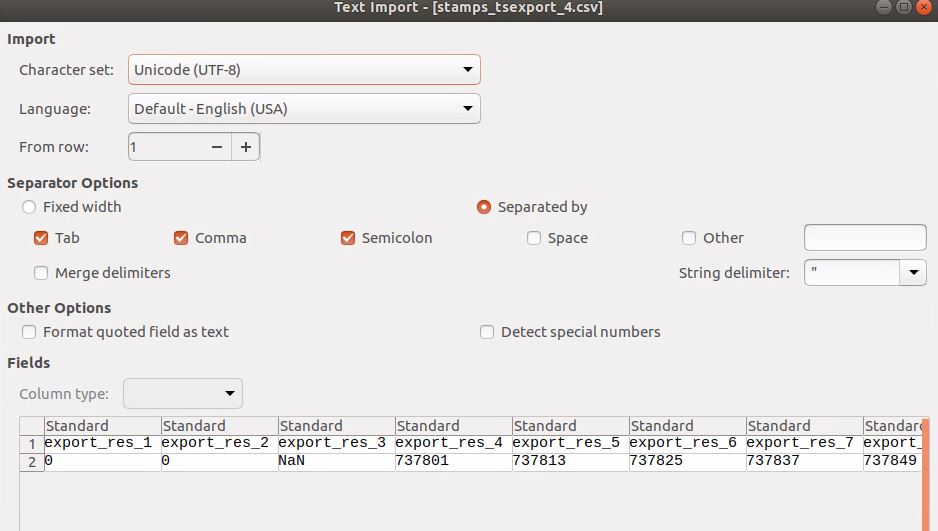
Here is the output I get. It seem like I am missing two more rows of the required format.

% the 'v-dao' parameter is an example you can change it to your needs
ps_plot('v-dao', 'a_linear','ts'); 

% a new window will open
% in the new window select a radius and location of the radius center to select the PS to 

load parms.mat;

% the 'v-dao' parameter is an example you can change it to your needs
% but be sure that you use the same paramters as above in the ps_plot()!
ps_plot('v-dao','a_linear',-1);

load ps_plot_v-dao.mat;
lon2_str = cellstr(num2str(lon2));
lat2_str = cellstr(num2str(lat2));
lonlat2_str = strcat(lon2_str, lat2_str);

lonlat_str = strcat(cellstr(num2str(lonlat(:,1))), cellstr(num2str(lonlat(:,2))));
ind = ismember(lonlat_str, lonlat2_str);

disp = ph_disp(ind);
disp_ts = ph_mm(ind,:);
export_res = [lonlat(ind,1) lonlat(ind,2) disp disp_ts];

metarow = [ref_centre_lonlat NaN transpose(day)-1];
k = 0;
export_res = [export_res(1:k,:); metarow; export_res(k+1:end,:)];
export_res = table(export_res);

% you can specify the location and name of the .csv export by renaming the second parameter
writetable(export_res,'stamps_tsexport_4.csv')

I am also getting the horzcat error. I tried adding very large area as below. But the error still persists. I even restarted my machine and changed the radius again and again but that error doesnt seems to goaway/
Error

Area

Following is my study area

Really appreciate if someone could point out a workaround for this.

I restarted matlab and did it again in that case error did not occur again

@thho @ABraun

Hello,

Do you know any solutions to this problem when exporting the StaMPS results?

Unrecognized function or variable ‘ref_centre_lonlat’.

Thank you.

How do I create suitable csv file for plotting baseline stamps visualizer?


I keep getting this error. please help!

Maybe it’s a bug. Have you solved it yet ?

could it be a version issue of StaMPS?

I was using the exactly the same version of StaMPS on the same data 3 month ago and no issue whatsovever. I suspect the newer Matlab version 2023a introduced this bug, as I was using 2022b

Typo: centrecenter.

I finally managad to create a csv and plotted a PSI baseline chart using stamps visualizer.

Look!

  1. Create a coregistered stack making sure the master date is the first image on the list and then make sure all slave images below the master are arranged properly in order (it will take long to create)

  2. Select your file on the product explorer then go to view
    Tool windows
    Radar
    InSAR stack

  3. click on baselines tab

  4. Copy all those data including the exact titles for each column (without any spaces) and paste them into an excel sheet and save the latter as comma delimited .csv format

  5. load that .csv file into this path /home/shadi/StaMPS_Visualizer-master/input/baseline_info (replace shadi with your own username of course)

  6. Open stamps visualizer and click run app, then click on Baseline plot then select the name of the .csv file you have put inside the path in step 5) and Voila

I still have a question though. How do I manipulate the chart to make the date of each slave scene appear beside each dot?

I already suspected that too but unfortunately it didn’t solve the problem. If you have any other suggestions please share them!

It’s ok. We can directly create baseline plot using ASF Vertex.

Could we show the dates of each scene and show additional information like this ? I am still not sure how but I don’t think it would really give valuable information when compared to the struggle behind creating such complex chart

I checked the Matlab source, but no longer have Matlab after retiring. The Matlab code does use centre, but the problem comes from getparm.m, which has:

function [value,parmname]=getparm(parmname,printflag)
%GETPARM get parameter value from parms.mat
%   GETPARM(PARMNAME)
%   Only enough characters of PARMNAME to make it unique need be typed

You could try using ref_cent.

Sometimes errors like this are caused by editing text files with a Windows editor. Linux uses one
“newline” character, Windows uses 2 characters. Another source of problems is Unicode “look-alike” characters. Some Unicode fonts have multiple variants for dashes and underscores (different widths).