That is what the subtract offset button in the StaMPS-Visualizer does, though not in StamPS in Matlab and neither do I know from the top of my head how to accomplish that, but should not be to hard.
However, @asterios_papas, much of the plots is relative and I alwys need some time to wrap my head around it ;). If I do understand the PS plot of StamPS right, they are relative to the prime date, hence the first date does not start at 0. What the StamPS-Visualizer does is to simply offset all measurement points (MP) in order to let the curve start at 0 on the first date.
Lets discuss an example:
Assumptions:
- you have this series of images [t-1, t, t+1] where t is the prime date
- lets assume that we look at a MP on a slope that from t-1 constantly moves downslope.
- also MP’s position is along the line of sight (LOS) of our sensor
- lets assume we have just ascending images, and the slope we look at is west->east orientated (so S1 would look downslope and therewith in the direction the MP moves)
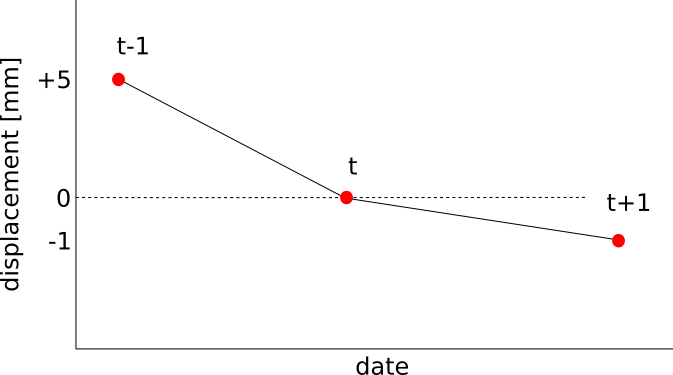
In this setting, we would have this time series plot:

- in t-1 the point is relative to t upslope therefore its displacement is positive
- in t the point is relative to t…well exactly the same hence 0
- in t+1 the point moved (in this example a bit slower, hence the slope is less steep) further downslope and lies in t+1 beneath t, hence -1 mm displaced relative to the t position.
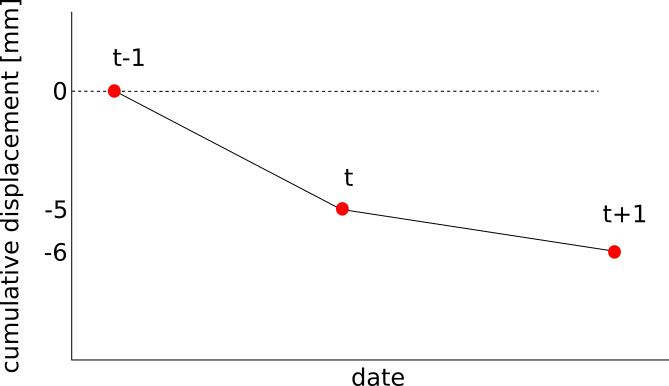
If you want to get a “cumulative” displacement (the entire distance the MP has moved from t-1 to t+1) you have to subtract the offset:

In publications, I recognized, that cumulative displacement is used more often.
So, this is how I explain it to me, comments on that?