Thank you so much. While processing I did that (selected the subtract topographic phase). I thick no need to run again the Topographic phase removal. Is it correct?
while processing I used around 5 burst, but I didn’t go though the Enhanced spectra diversity step. Is it must to process the ESD step?
Yes, it is highly recommended, since you are looking at minimal phase differences in DInSAR and ESD is meant to minimize divergence of the signal of different bursts which originate from the sinsing method but do not represent “real” differences, in which you are interested (roughly speaking). For more theoretical background and explanation, start reading the Help in SNAP of the ESD operator.
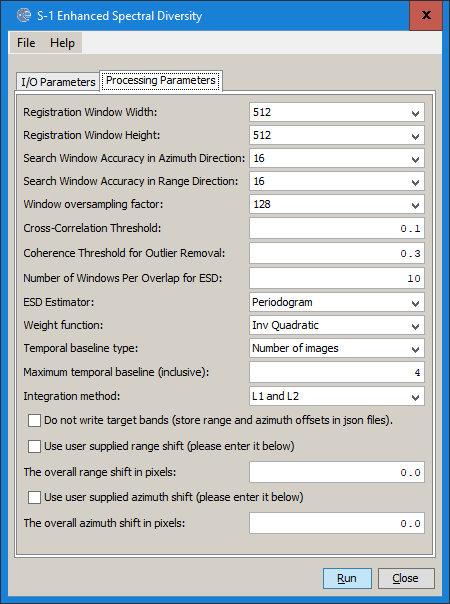
from your screenshot I see that you are using an old version of SNAP, please install version 8 and all updates - at best with deleting old user configuration data as shown here.
Hi @thho, I have installed this new version of StaMPS-Visualizer on VirtualBox Ubuntu 18.04, R 3.6.3 and RStudio 1.2.5033, but when I visualize PS in the plot, after while that I’m moving the maps, Ubuntu blocks (only with a .csv upload). Do you know the reason?
Thanks.
maybe that is because of the number of PS, I played around with the number but it highly depends on the systems hardware. Can you provide a the number of lines of the csv you try to visualize and hardware specs like RAM and CPU? Can you reproduce the error when you use the demo dataset Maoxian_PS?
My experience: Ubuntu 20.04 LTS / R3.6.3 / i7 CPU / 32G RAM was that with a csv of > 150.000 lines I have the same behaviour. Therefore, I build in the 50.000 threshold for custom csv data (the warning that pops up when you try to load a csv with more than 50k lines)
You can try to solve the issue by:
instead of using the RStudio browser to look at the app, start the app in the firefox web browser
reduce the number of points by subsetting to your aoi of interest.
Hi @abity,
next to the TS plot button is the radius (m) field, from the error, it seems to me, that you inserted a value, Matlab does not understand. It says that it tries to convert a string to numeric, but instead of a single value it receives a vector, what exactly did you enter in the field where we see 000?
just to be sure: after you entered the number, you click on the map to define the point from which the radius is applied to the image? Also, it might be go to see, how you call the ps_plot() function in the matlab command line.