Hi Jan,
I’ve just copied the metadata for you:
Driver: SENTINEL2/Sentinel 2
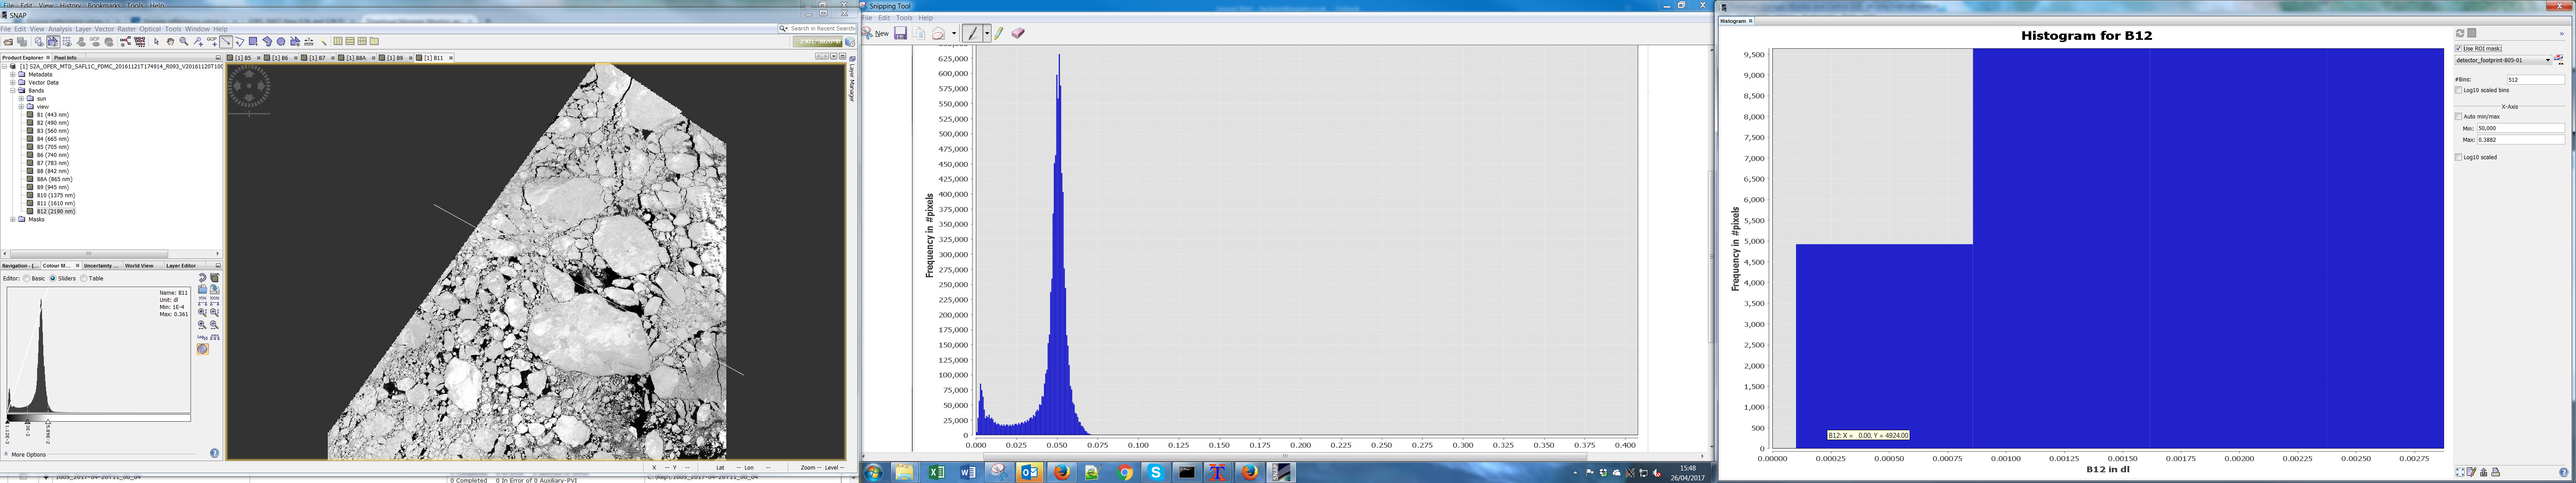
Files: S2A_OPER_MTD_SAFL1C_PDMC_20161121T174914_R093_V20161120T100152_20161120T100152.xml
Size is 512, 512
Coordinate System is `’
Metadata:
CLOUD_COVERAGE_ASSESSMENT=0.0
DATATAKE_1_DATATAKE_SENSING_START=2016-11-20T10:01:52.026Z
DATATAKE_1_DATATAKE_TYPE=INS-NOBS
DATATAKE_1_ID=GS2A_20161120T100152_007383_N02.04
DATATAKE_1_SENSING_ORBIT_DIRECTION=DESCENDING
DATATAKE_1_SENSING_ORBIT_NUMBER=93
DATATAKE_1_SPACECRAFT_NAME=Sentinel-2A
DEGRADED_ANC_DATA_PERCENTAGE=0
DEGRADED_MSI_DATA_PERCENTAGE=0
FOOTPRINT=POLYGON((-30.23121359203619 -73.88523809095295, -30.00996714138066 -73.8088375025861, -29.676127801902048 -73.69131716069539, -29.34714455052908 -73.57318214157297, -29.022775798383847 -73.45447781062563, -28.702796400730445 -73.3353750526158, -28.38676369098438 -73.21595783287603, -28.074812493826524 -73.09623347208702, -27.797548938970436 -72.98807425960285, -27.725592287870583 -72.98856027053438, -27.07738784481399 -73.11499774144512, -27.094751948140228 -73.12188515388958, -26.697344155371386 -73.19716967223816, -26.683165143945462 -73.97970634881884, -30.244249859642604 -73.95553305513582, -30.23121359203619 -73.88523809095295, -30.23121359203619 -73.88523809095295))
FORMAT_CORRECTNESS_FLAG=PASSED
GENERAL_QUALITY_FLAG=PASSED
GENERATION_TIME=2016-11-21T17:49:14.000114Z
GEOMETRIC_QUALITY_FLAG=PASSED
PREVIEW_GEO_INFO=BrowseImageFootprint
PREVIEW_IMAGE_URL=https://pdmcdam2.sentinel2.eo.esa.int/s2pdgs_geoserver/geo_service.php?service=WMS&version=1.1.0&request=GetMap&layers=S2A_A007383_N0204:S2A_A007383_N0204&styles=&bbox=-30.244249859642604,-73.97970634881884,-26.683165143945462,-72.98807425960285&width=1321&height=367&srs=EPSG:4326&format=image/png
PROCESSING_BASELINE=02.04
PROCESSING_LEVEL=Level-1C
PRODUCT_START_TIME=2016-11-20T10:01:52.026Z
PRODUCT_STOP_TIME=2016-11-20T10:01:52.026Z
PRODUCT_TYPE=S2MSI1C
PRODUCT_URI=S2A_OPER_MSI_L1C_TL_SGS__20161120T144941_A007383_T26CMD_N02.04
QUANTIFICATION_VALUE=10000
RADIOMETRIC_QUALITY_FLAG=PASSED
REFERENCE_BAND=B1
REFLECTANCE_CONVERSION_U=1.02339495218124
SENSOR_QUALITY_FLAG=PASSED
SPECIAL_VALUE_NODATA=0
SPECIAL_VALUE_SATURATED=65535
Subdatasets:
SUBDATASET_1_NAME=SENTINEL2_L1C:S2A_OPER_MTD_SAFL1C_PDMC_20161121T174914_R093_V20161120T100152_20161120T100152.xml:10m:EPSG_32726
SUBDATASET_1_DESC=Bands B2, B3, B4, B8 with 10m resolution, UTM 26S
SUBDATASET_2_NAME=SENTINEL2_L1C:S2A_OPER_MTD_SAFL1C_PDMC_20161121T174914_R093_V20161120T100152_20161120T100152.xml:20m:EPSG_32726
SUBDATASET_2_DESC=Bands B5, B6, B7, B8A, B11, B12 with 20m resolution, UTM 26S
SUBDATASET_3_NAME=SENTINEL2_L1C:S2A_OPER_MTD_SAFL1C_PDMC_20161121T174914_R093_V20161120T100152_20161120T100152.xml:60m:EPSG_32726
SUBDATASET_3_DESC=Bands B1, B9, B10 with 60m resolution, UTM 26S
SUBDATASET_4_NAME=SENTINEL2_L1C:S2A_OPER_MTD_SAFL1C_PDMC_20161121T174914_R093_V20161120T100152_20161120T100152.xml:PREVIEW:EPSG_32726
SUBDATASET_4_DESC=RGB preview, UTM 26S
Corner Coordinates:
Upper Left ( 0.0, 0.0)
Lower Left ( 0.0, 512.0)
Upper Right ( 512.0, 0.0)
Lower Right ( 512.0, 512.0)
Center ( 256.0, 256.0)
Thanks for your help,
Julius