Strange results for SBAS (GMTSAR + StaMPS)

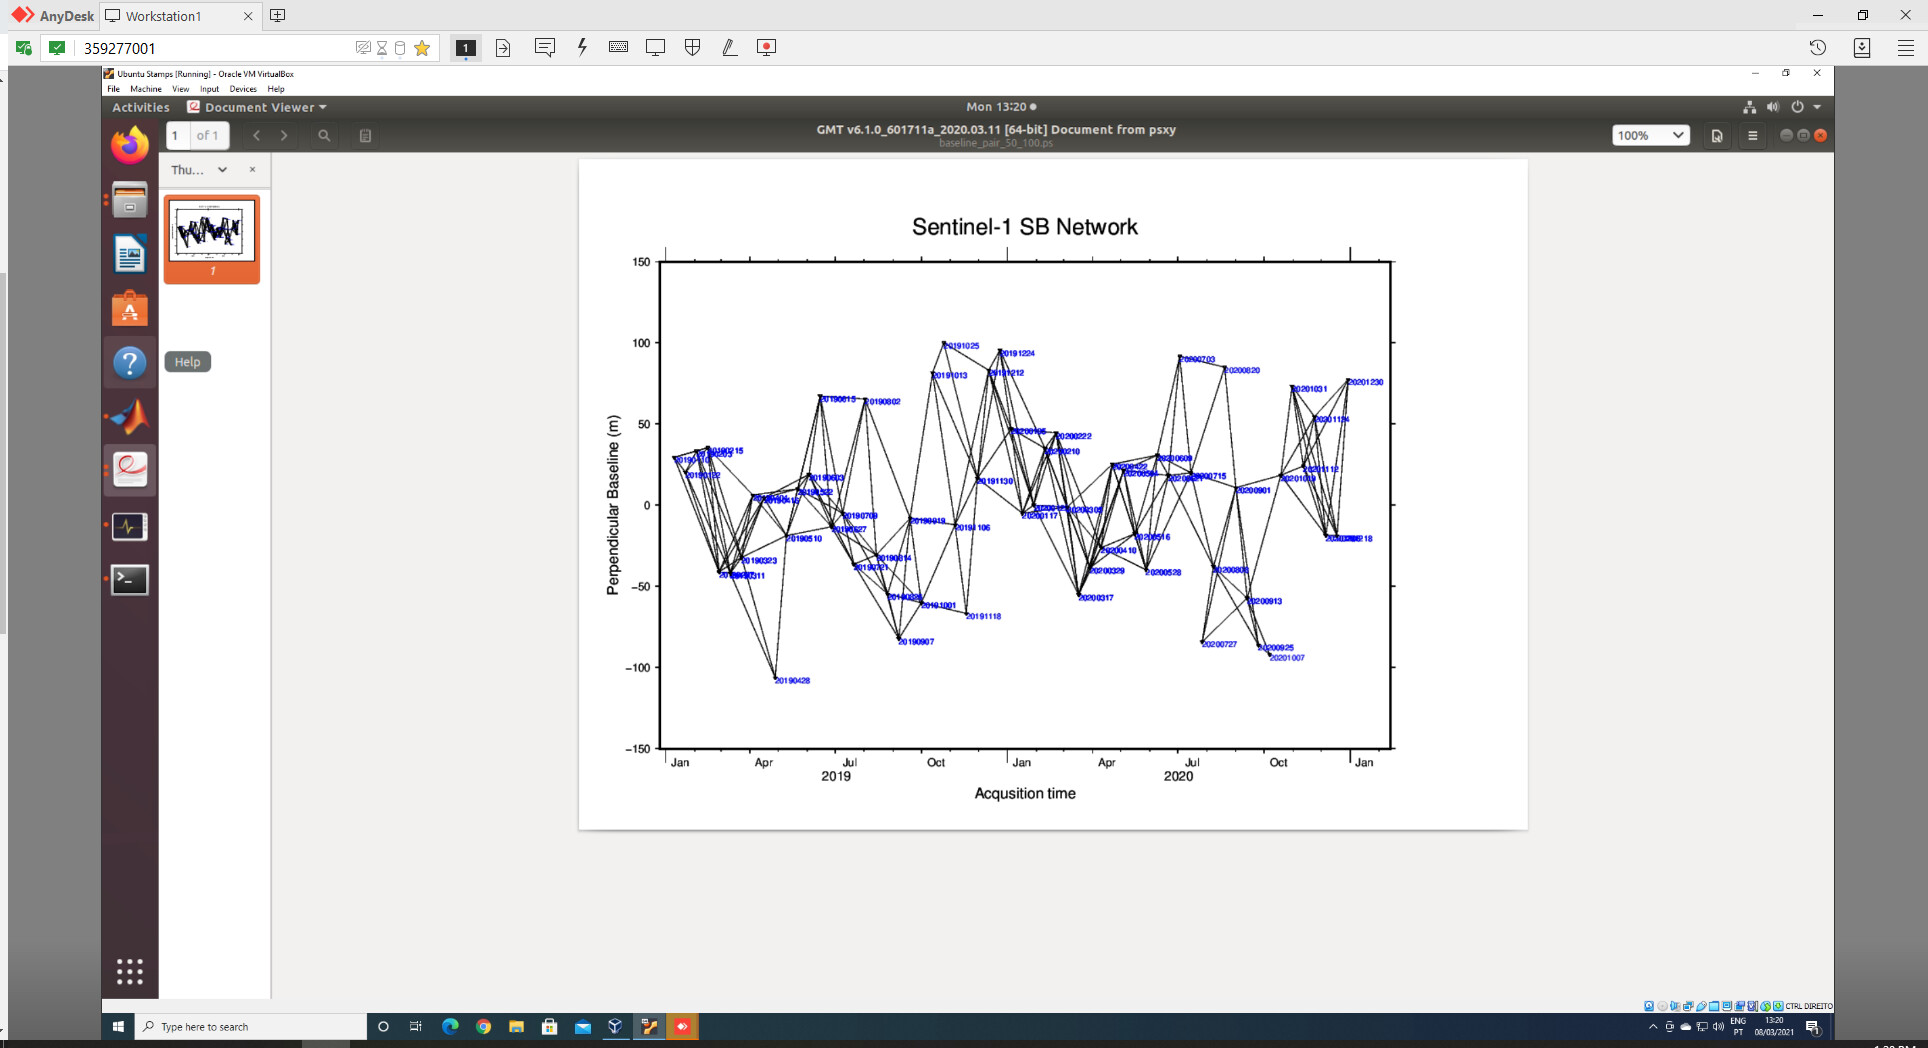
Hello all, I have just finished processing SBAS using GMTSAR + StaMPS and I get this very strange result:

ps_plot(‘u’) shows the same problem:

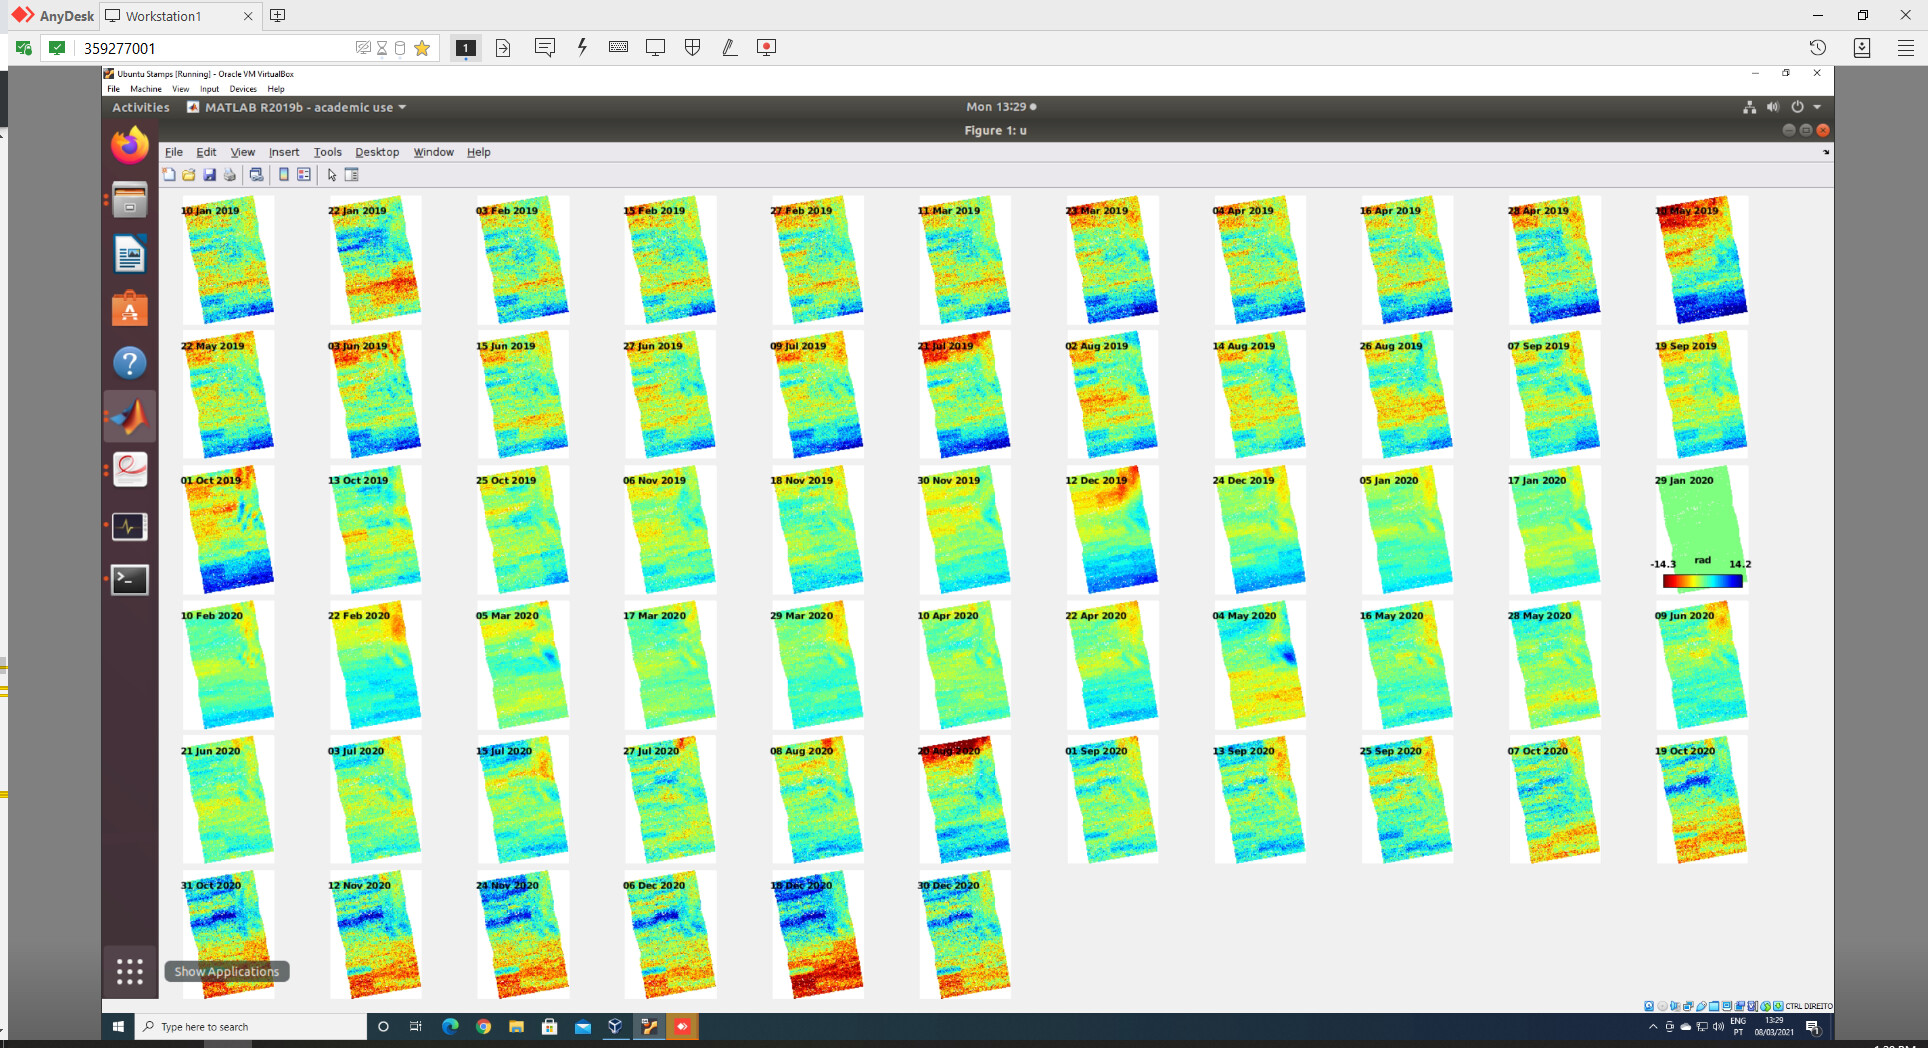
Does anyone recognize this anomaly?

Using the following params in Stamps with amplitude dispersion index of 0.6:

                          Created: '01-Mar-2021'
                       clap_alpha: 1
                        clap_beta: 0.3000
         clap_low_pass_wavelength: 800
                         clap_win: 32
                     density_rand: 2
                   drop_ifg_index: []
                 filter_grid_size: 50
                 filter_weighting: 'P-square'
         gamma_change_convergence: 0.0050
             gamma_max_iterations: 3
               gamma_stdev_reject: 0
                          heading: -13.5919
                  insar_processor: 'gmtsar'
                           lambda: 0.0555
                    lonlat_offset: [0 0]
                     max_topo_err: 20
              merge_resample_size: 0
               merge_standard_dev: Inf
                          n_cores: 8
                     percent_rand: 1
                plot_color_scheme: 'inflation'
                 plot_dem_posting: 90
            plot_pixels_scatterer: 3
              plot_scatterer_size: 120
             quick_est_gamma_flag: 'y'
                ref_centre_lonlat: [0 0]
                          ref_lat: [-Inf Inf]
                          ref_lon: [-Inf Inf]
                       ref_radius: Inf
                     ref_velocity: 0
               sb_scla_drop_index: []
                      scla_deramp: 'n'
                  scla_drop_index: []
                      scla_method: 'L2'
                   scn_deramp_ifg: []
                 scn_kriging_flag: 'n'
                     scn_time_win: 365
                   scn_wavelength: 100
                    select_method: 'DENSITY'
          select_reest_gamma_flag: 'y'
                  shade_rel_angle: [90 45]
                          slc_osf: 1
              small_baseline_flag: 'y'
                      subtr_tropo: 'n'
                     tropo_method: 'a_l'
                     unwrap_alpha: 8
                unwrap_gold_alpha: 0.8000
                unwrap_gold_n_win: 32
                 unwrap_grid_size: 200
          unwrap_hold_good_values: 'n'
             unwrap_la_error_flag: 'y'
                    unwrap_method: '3D_QUICK'
               unwrap_patch_phase: 'n'
            unwrap_prefilter_flag: 'y'
    unwrap_spatial_cost_func_flag: 'n'
                  unwrap_time_win: 730
                   weed_max_noise: Inf
                  weed_neighbours: 'n'
                weed_standard_dev: Inf
                    weed_time_win: 730
              weed_zero_elevation: 'n'

Hi Stefan,

Have you already found the problem? Yes, it’s a kinda strange result for unwrapped. Can you do ps_plot(‘w’) and ps_plot(‘usb’)? Do they also look strange?

You might also check the amplitude difference dispersion (ADD) from scatter_SB.ps inside the raw folder.

Hi Stefan!

Sorry for out of topic. Do you have any documents to do the GMTSAR+STAMPS?

thanks

No, but if you have any problems I would check on the GMTSAR Forum.

1 Like

Unfortunately I moved on to another orbit as I couldn’t trust these results.

I just have an irrelevant question if you wouldn’t mind. How could you get snap or Matlab to plot this Acquisition time vs Perpendicular baseline chart ?

If you are using GMTSAR then preproc_batch_tops.csh will generate a .ps file with time x baseline graph.

Unfortunately my study area isn’t available yet for GMTSAR data base. I am using Snap and Matlab_operated StaMPS

In SNAP you can generate a baseline graph from your InSAR Stack. Is this what you are looking for?

I have checked this out earlier and this method requires a single stack file of all the input co-registered scenes, while the automated snap processing produces multiple stack files of co-registered master-slave pairs which isn’t a valid input for the baseline chart tool in SNAP. I do, however, appreciate attempting to help :blush:

Are you doing SBAS? (Multi-Master?

PSI single master

I’m not too sure how I can help in that case. A custom python script would probably be suitable, you could use matplotlib to generate your graphs. Good luck.

Hello, how do you convert the interferogram in SBAS format produced by GMTSAR into STAMPS format for timing processing? Can you provide a tutorial, now I am struggling with this problem, I am working with Sentinel 1 data, I see other tutorials convert but not sentinel data.

Please look at INSAR_G2S