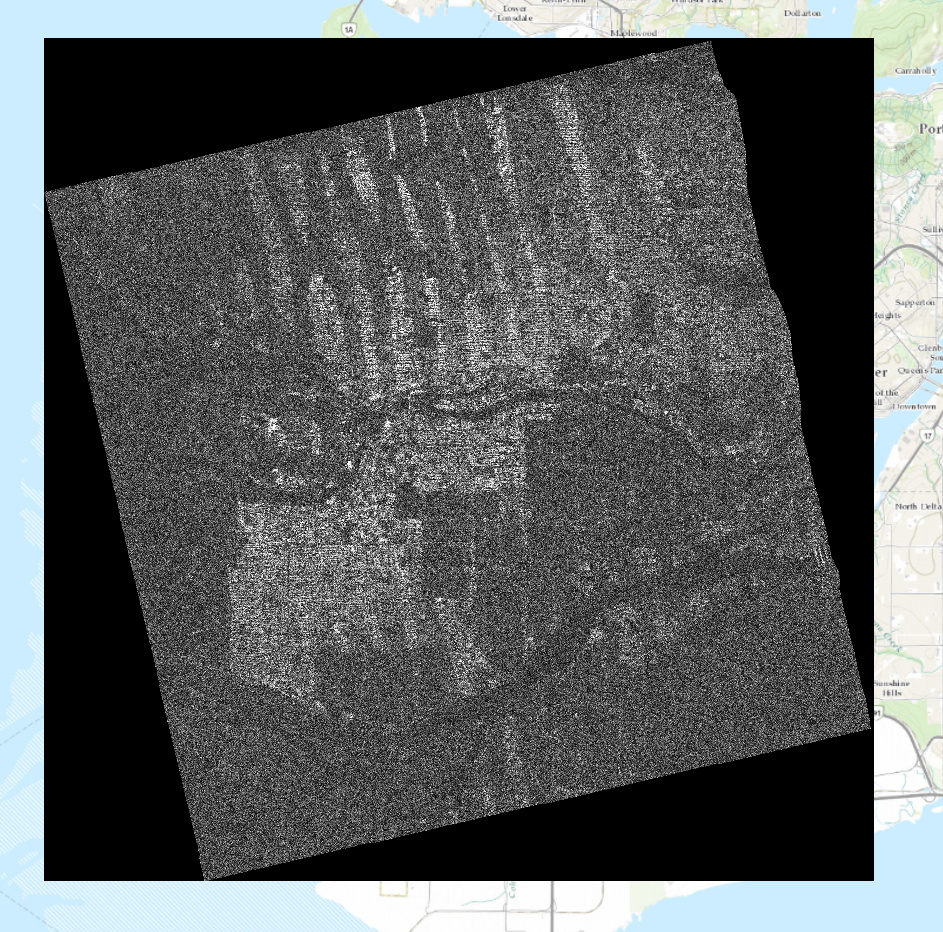
I have been working with a stack of Radarsat-2 images acquired over Vancouver, BC (urban area). Input data are: 26 U70 images acquired between 2013-05-05 and 2018-12-29. I processed the images in Stamps and obtained displacement values that are similar to those reported in the literature (yay!) but when looking at intermediate products I noticed striping in the coherence.
I wondered if it had something to do with the choice of master and changed the master image to be the middle image in the stack instead of the first one. That change didn’t have an effect. When running the same stack through Snaphu, these stripes aren’t present, though the processing and stacking is different (img1-img2, img2-img3, img3-img4 compared to img-1 - img2,img3,img4). Does anyone know what the striping could be related to? Is it related to the long temporal baseline, or maybe the stacking is off?
if these stripes only occur for one master, could it be related to linear land-use patterns? They don’t look too systematic actually. On the other side they are clearly aligned with the range of the image. Maybe changing the orbit interpolation degree could also bring a difference then.
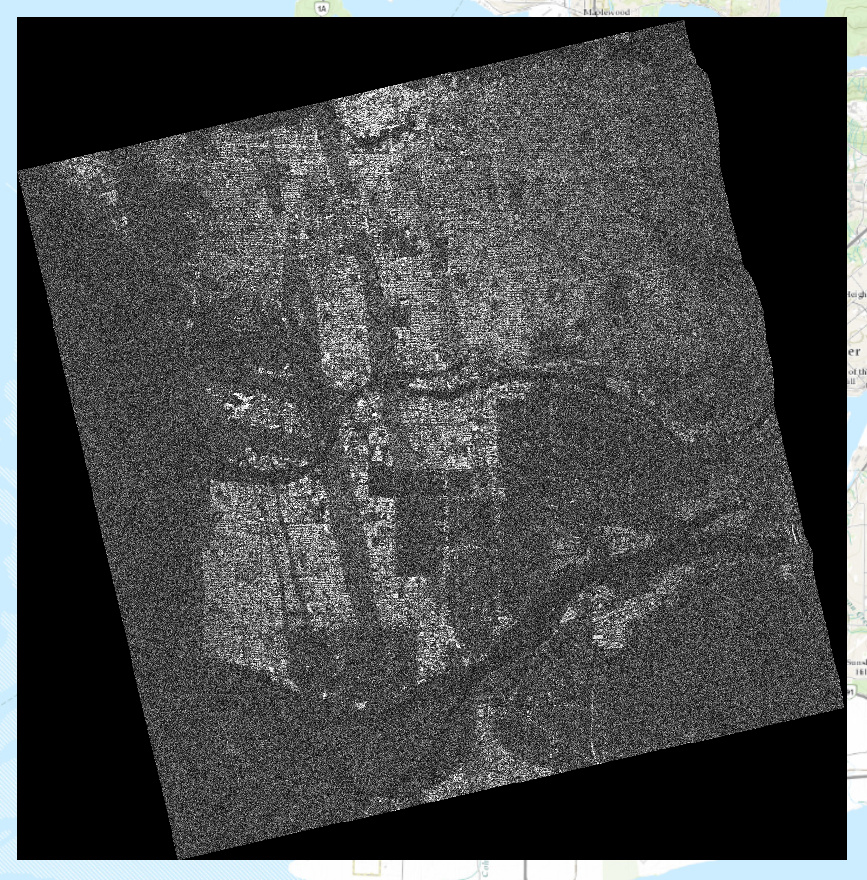
I changed the orbit interpolation to degree from 3 to 4, and the stripes remained. Then, I tried changing it to 5 but got the following error: “Number of points is smaller than parameters solved for”. It doesn’t appear to be related to land use patterns, because the stripes cut through urban, agricultural and forested areas. You are right though that they don’t appear too systematic. Interestingly, they are very variable in density and in placement, in some images they are quite dense on the western side near the water and low elevation areas, and sometimes they are more dense in the northern, high elevation areas. I will play with some other parameters and report back unless you have any other ideas. Thank you!
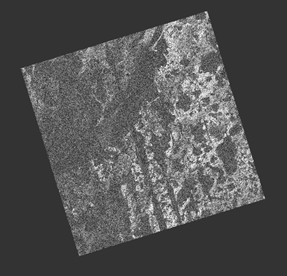
I also see a similar pattern in a different study area, but only for one image pair in a 14 image stack.
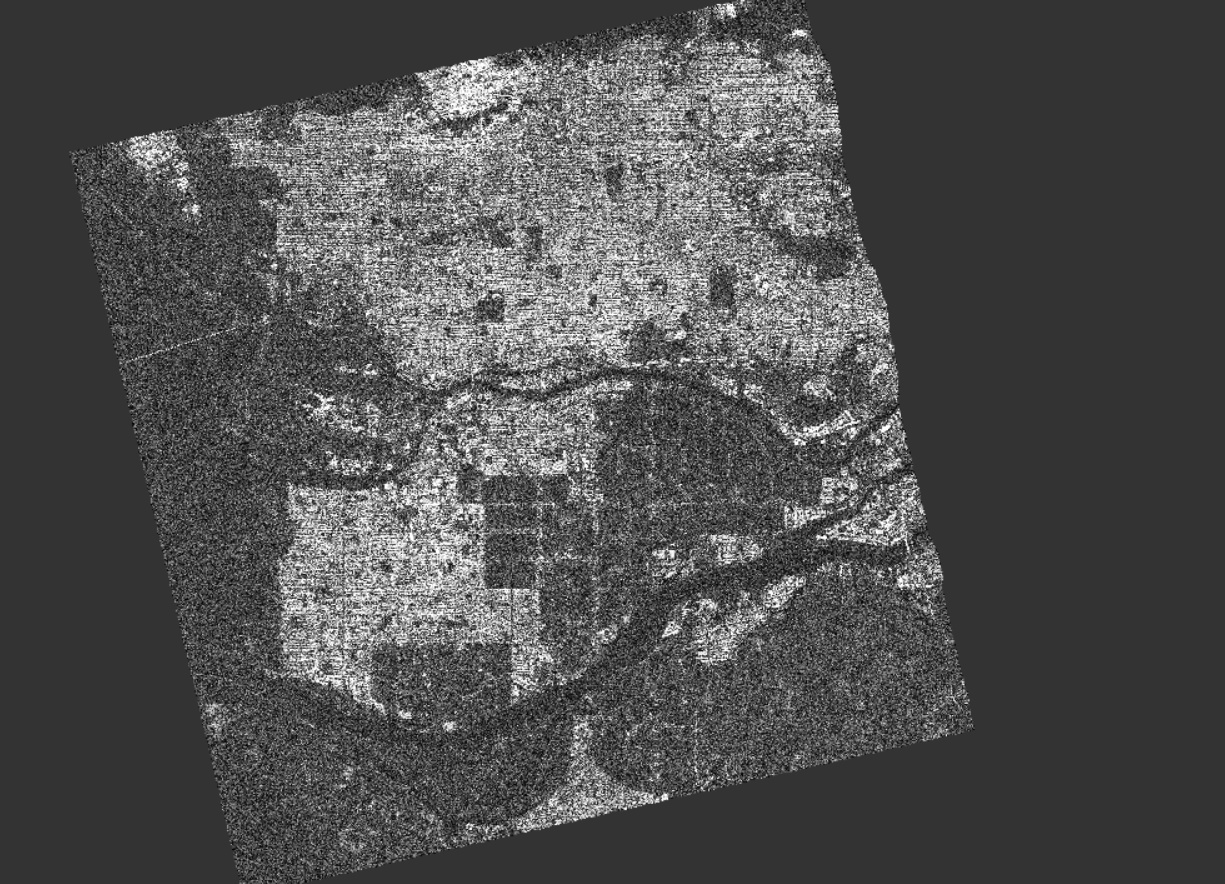
I think the resampling caused this issue because once I selected the extent to be “Master”, and no resampling was done, the stripes went away. It makes sense to me that resampling would cause some problems for InSAR calculations. As a result if I may suggest that a minimum extent option without resampling is implement. For example, there could be an extra option where the images are stacked to the master extent but then the final stack is clipped to the minimum extent.
Thank you for your help, hope this is useful to someone!
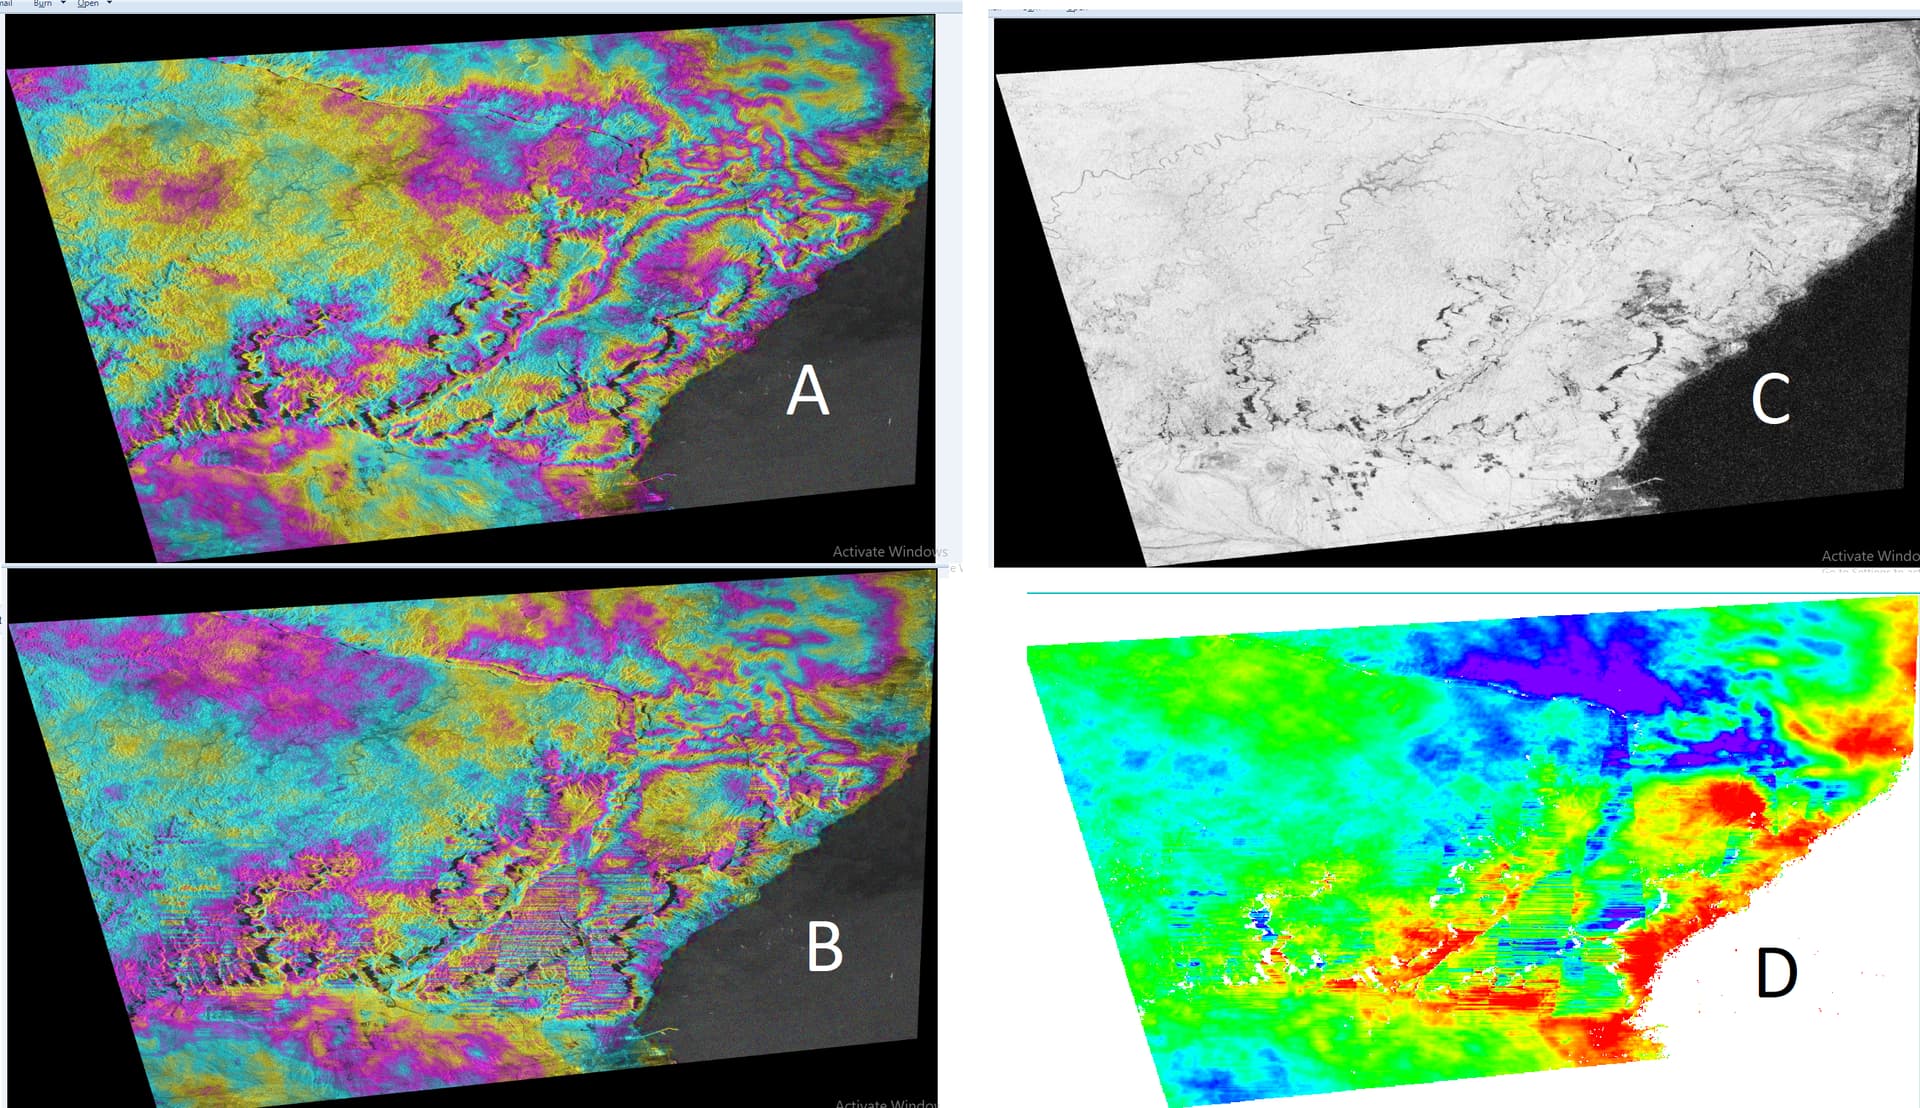
Sentinel-1 data
A) Flattened interferogram
B) Flattened interferogram after applying GACOS atmospheric filtering
C) Coherence
D) Unwrapped phase (in a different color pallete)
What could be causing this weird linear parallel stripe pattern near the bottom right sections of the images? I know it has been resulted after GACOS correction but why? I have used GACOS data with the acquisition time (date and hour ) of sentinel-1 acquisition time