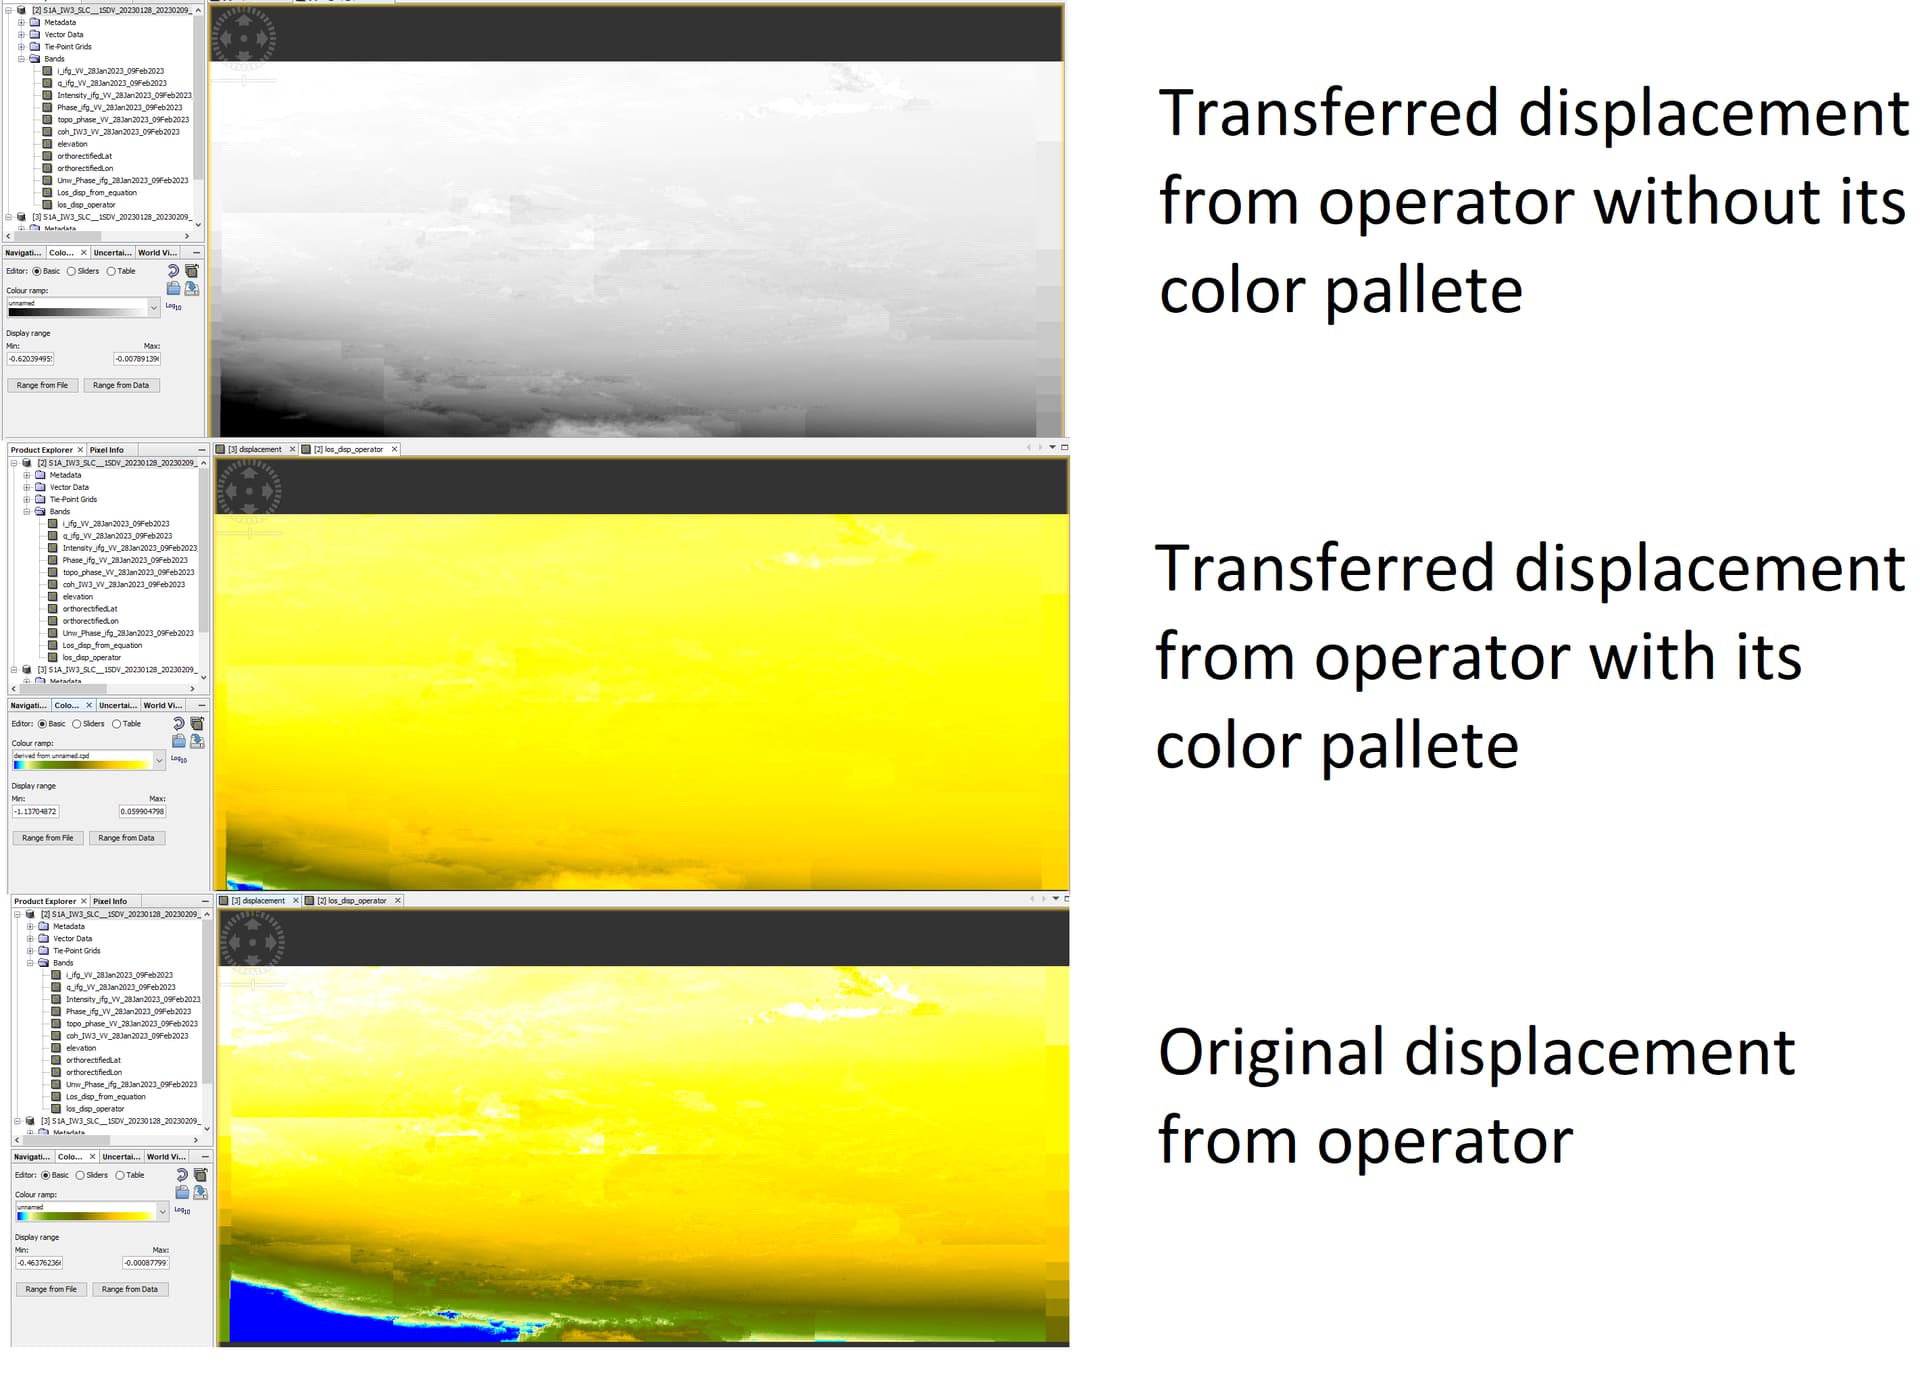
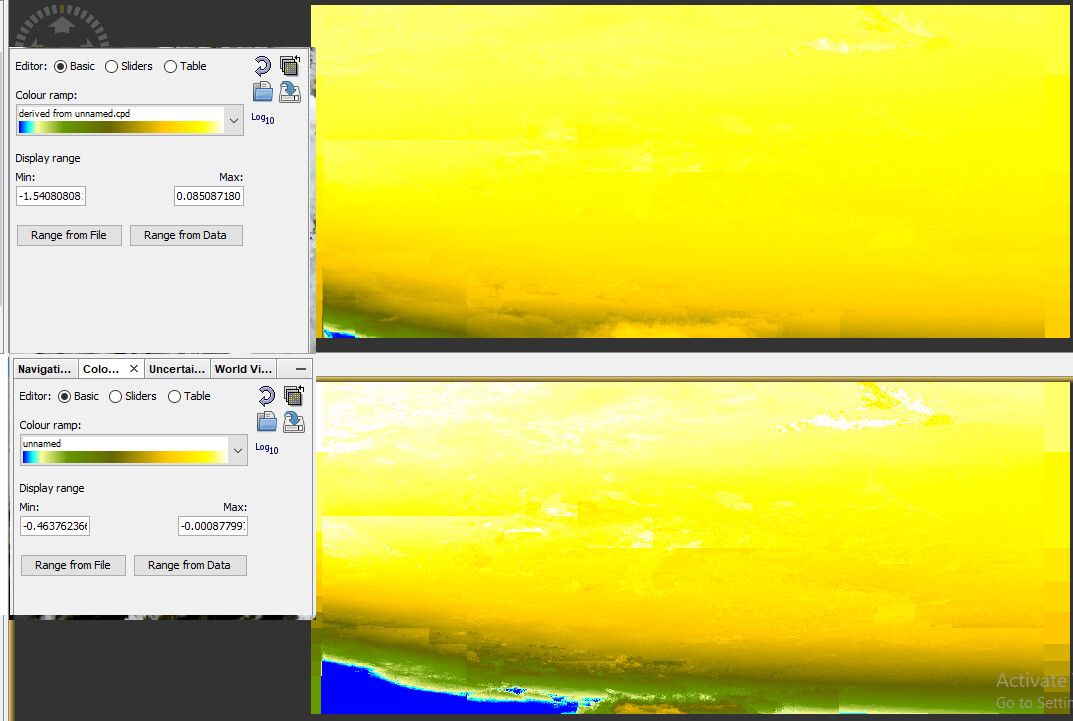
There’s a difference between the displacement map produced from Phase-to-displacement operator (bottom one) and the one extracted from bandmath (top one), Also difference in statistics
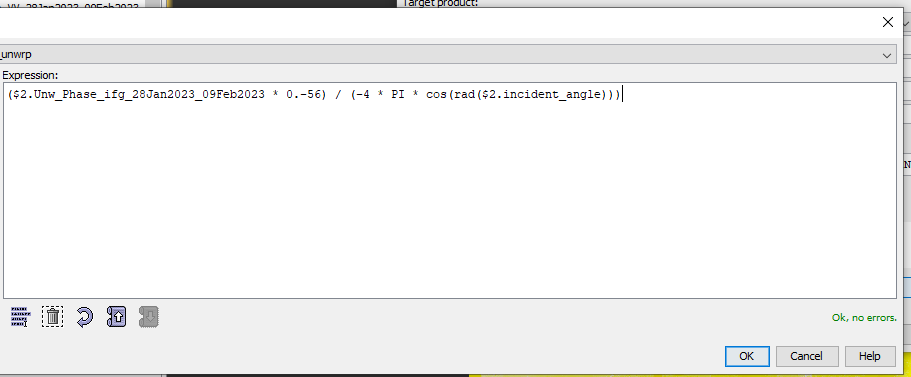
I have used the following expression
(Unw_Phase * wavelength in mm) / (-4 * PI )
What is even weirder, is that when transfer the phase to displacement band that was created using the operator, into the unwrappaed product package, the statistics also change and hence the color pattern (using the same exported and imported color palette) also changes, even adding a the color palette itself changes the statistcs. Here take a look please