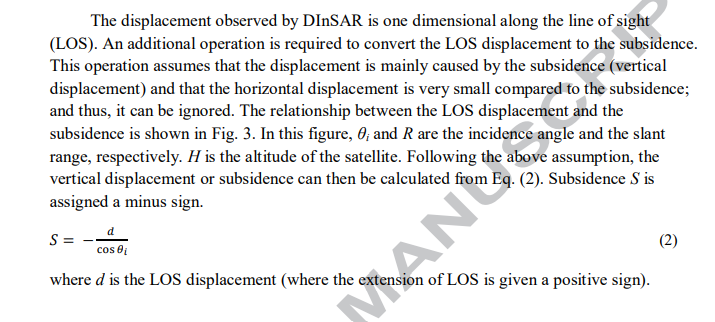
I had (stamps_tsexport.csv) and I want to calculate vertical displacement or subsidence from relation :
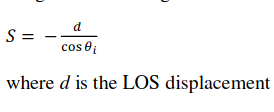
Based on the reference( Monitoring of long-term land subsidence from 2003 to 2017 in coastal area of Semarang, Indonesia by SBAS DInSAR analyses using Envisat-ASAR, ALOS-PALSAR, and Sentinel-1A SAR data)
How can I do this using snsp or what ? please help and thank you in advance
This equation is not very precise, but an approximation of actual displacement.
I don’t know how do implement it in Matlab (would probably be the easiest way), but if you have already exported it to CSV, you can load it into a GIS (e.g. QGIS) together with a raster of the local incidence angle (exported from SNAP) and extract the angles to each PS point. In the attribute table of the points you could then apply the equation based on both variables.
I explained how to load the CSV into QGIS here: StaMPS-Visualizer, SNAP-StaMPS Workflow - #315 by ABraun
hello ABraun … I want to calculate vertical displacement …Please help me understand this relationship. Is it intended that I always replace LOS displacement with a positive value even if it is negative?
Thank you dear in advance
hello ABraun … I want to calculate vertical displacement …Please help me understand this relationship. Is it intended that I always replace LOS displacement with a positive value even if it is negative?
Based on the reference( Monitoring of long-term land subsidence from 2003 to 2017 in coastal area of Semarang, Indonesia by SBAS DInSAR analyses using Envisat-ASAR, ALOS-PALSAR, and Sentinel-1A SAR data)
Thank you dear in advance
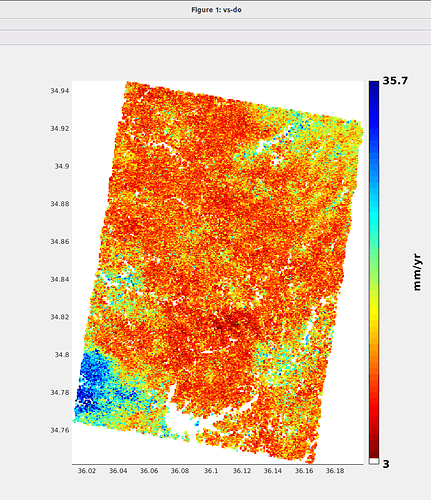
I had (vs-do)
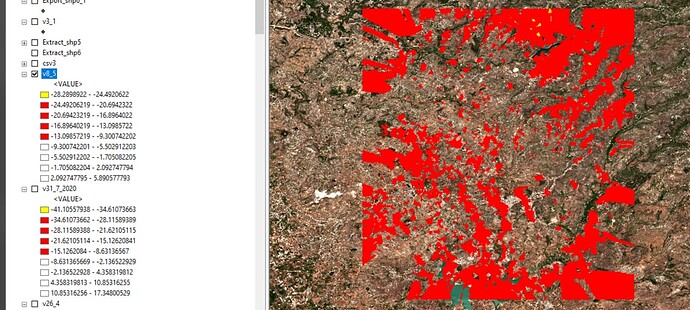
does this mean that there is wrongs in my results… because when I calculate vertical displacements I have errors in the edges
please help
I have entered a similar expression
if coh_IW3_VV_09Dec2016_31May2016 >= 0.97 then coh_IW3_VV_09Dec2016_31May2016 else 0
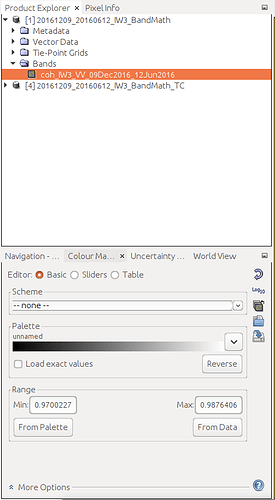
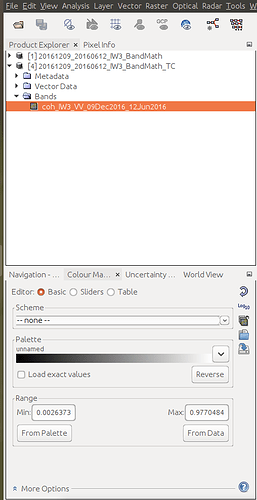
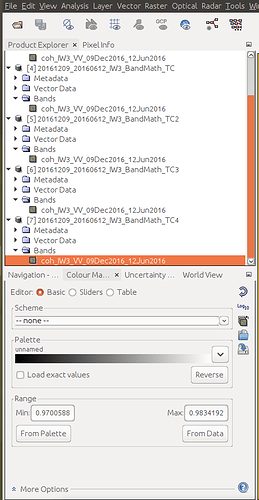
and the result new coherence band had shown only the pixels whose value is a equal or above the condition parameter. but when I applied range doppler terrain correction to the new coherence band, few more pixels have appeared whose value is below 0.97 which doesn’t match the condition.
here’s the data statistics of the input coherence map before terrain correction and the output after the correction
A) What could be the problem?
B) Should i do terrain correction before coherence masking ?
Edit, I have tried changing the image and DEM resampling method from bilinear interpolation to the nearest neighbor in order to preserve the original pixel values from the source image grid instead of averaging the values of multiple pixels and creating a new value into the output corrected grid and yes the problem seems to have been partially solved as there are no more pixels with coherence values that are different the conditional case in the source band. However the minimum and maximum values don’t exactly match the source band
Are those new coherence values representative since the image statistics have changed?
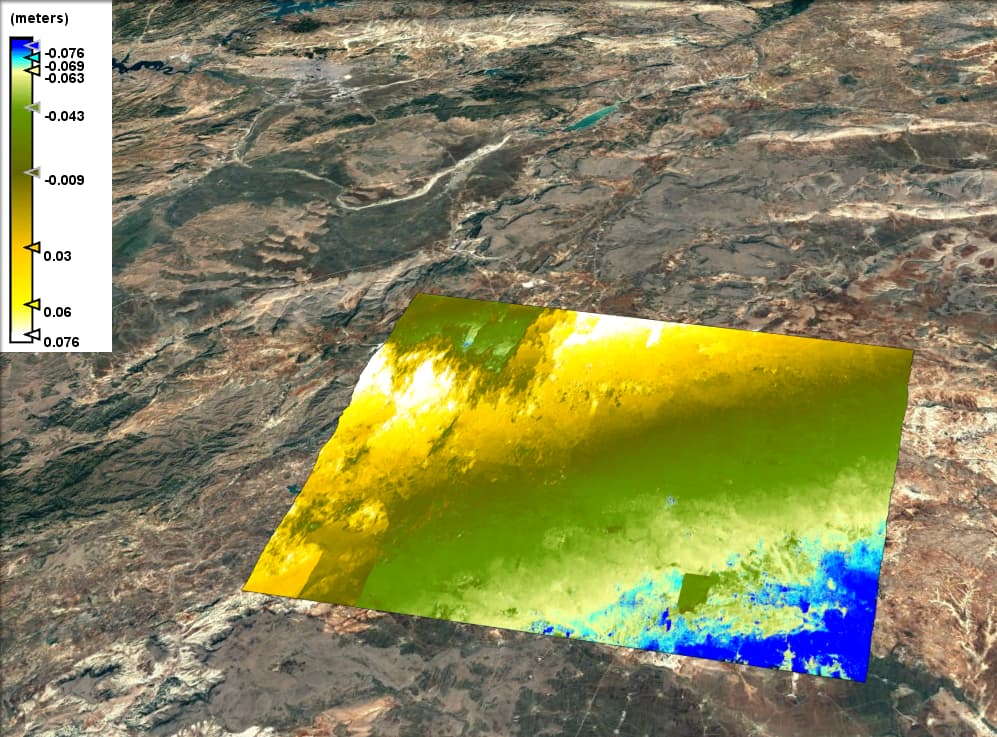
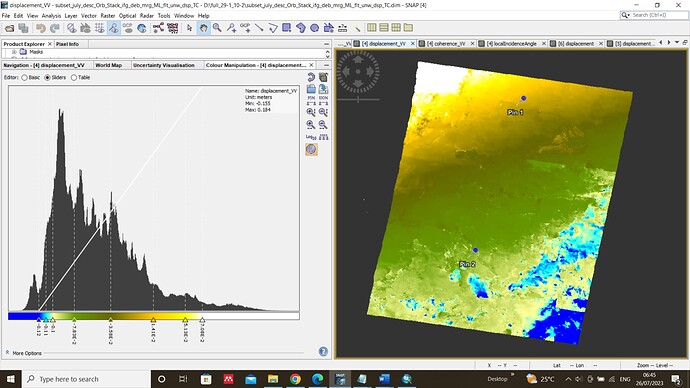
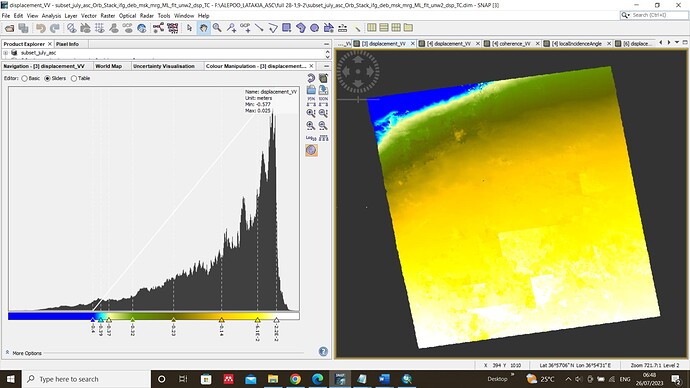
hello when I generate displacement in snap(displacement_vv) and export view as google earth kmz , the values of displacement change
What makes you think that they change? The histogram indicates that the data ranges between -0.11 and +0.18. The color legend in Google Earth might not cover the entire range of values in favour of better contrasts.
Thank you for your kindness and response
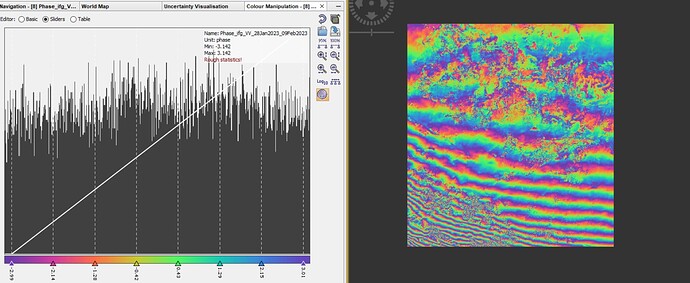
How do Exclude those areas from the interferogram itself before performing phase unwrapping?
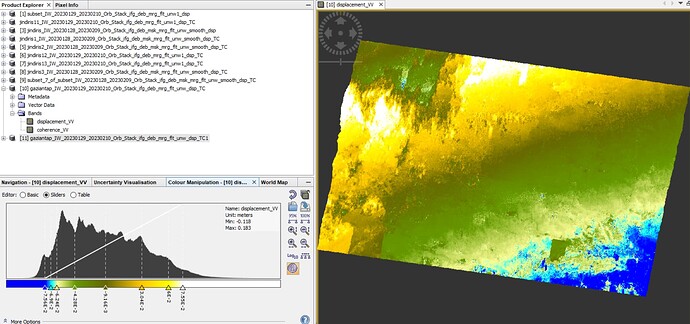
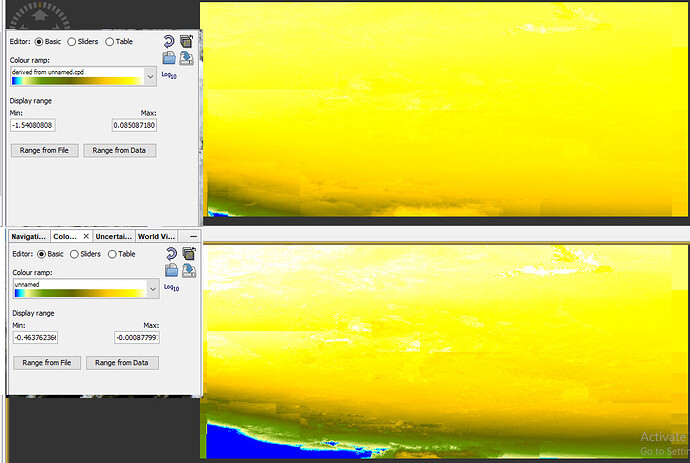
There’s a difference between the displacement map produced from Phase-to-displacement operator (bottom one) and the one extracted from bandmath (top one), Also difference in statistics
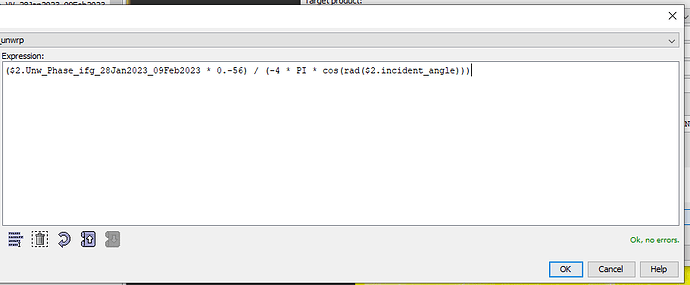
I have used the following expression
(Unw_Phase * wavelength in mm) / (-4 * PI )
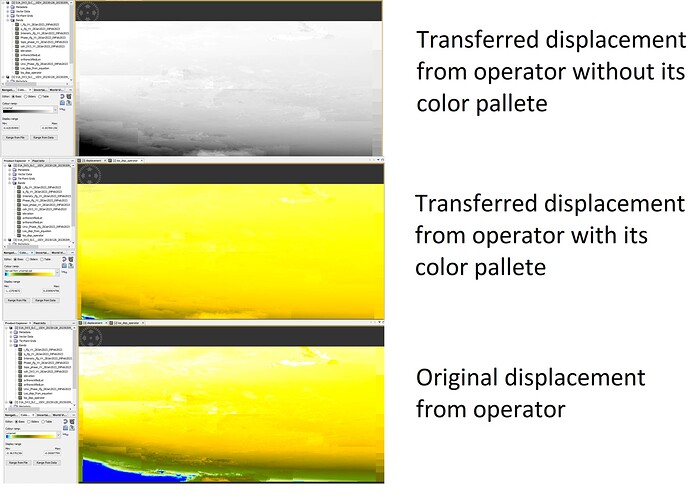
What is even weirder, is that when transfer the phase to displacement band that was created using the operator, into the unwrappaed product package, the statistics also change and hence the color pattern (using the same exported and imported color palette) also changes, even adding a the color palette itself changes the statistcs. Here take a look please
be careful, these numbers only affect how the data is displayed, e.g. which color is assigned to each value. you can manually modify it or move the slider to change it. But the pixel values stay the same. You can use the statistics tool to calculate the actual range of pixel values.
@ABraun Thank you for your constant assistance in all my inquiries and I hope Excuse me for my ignorance sometimes
I obtained the displacement from an ascending orbit and a descending orbit in order to calculate the horizontal and vertical displacements resulting from the earthquake using the equations
, but when I compare with the values of the measurements of the displacements of two GPS points available in the study area, I find a difference. What is the reason and what should I do to get the same values
thank you very much in advance
GPS is point-based temporal resolution is very high and spatial resolution is very less, in the case of InSAR it is the reverse.
I think you are using only two SAR images which is very difficult to match with GPS. Better try with PS-InSAR (at least three years of SAR data is required) to match InSAR vertical with GPS vertical.
Thank you very much, but I am studying the displacements caused by 7.8 magnitude earthquake .
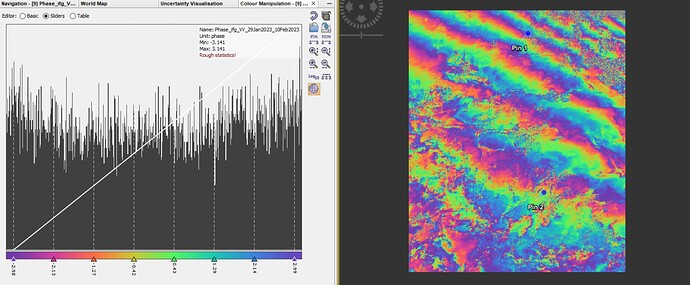
Have you seen any fringes in the interferogram?
Hi,
I have been following the SNAP Subsidence tutorial here and I was able to reproduce the results. However, when I try the same process with Sentinel 1A data I encounter some issues which I am hoping the community will help.
Data: 2023 IW2
Period: March to October. I select the latest product of each month for interferometry
Location: 3.076665°N 32.152314°E
Context: This Area is in an active fault line region and there was a lot of activity in the during the period. This includes two magnitude 4 earth quakes and floods.
The area is very sparsely populated with some trees and shrubs.
Issues:
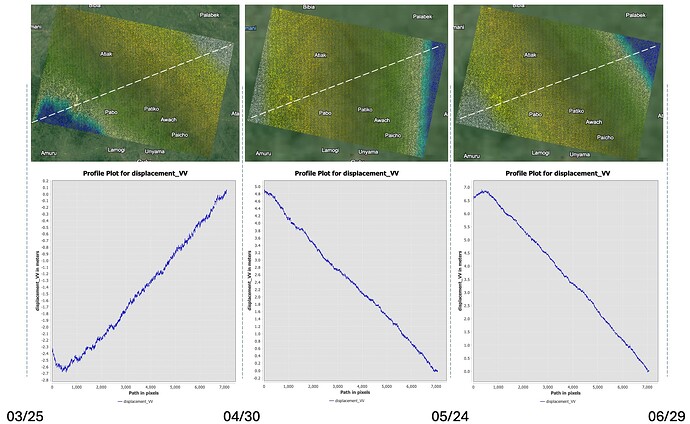
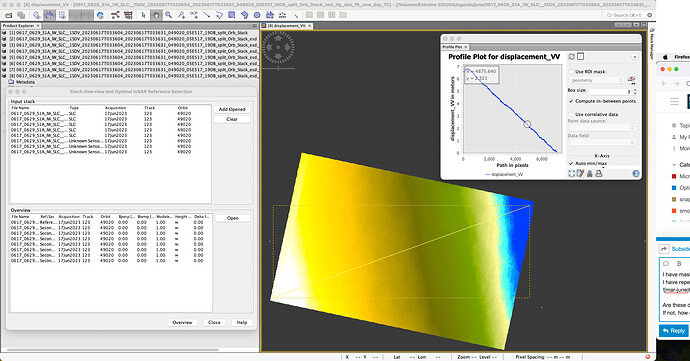
After phase unwrapping and terrain correction, I notice huge displacements near the Fault line region, there is -8m subsidence at some point and +7 uplift at another point and these are over 1 month duration so I think there is something wrong.
My Attempts:
I have masked out coherence below 0.3
I have repeated the process including unwrapping with same results.
Example June 17 to June 29 without Coherence mask
Reference Product S1A_IW_SLC__1SDV_20230617T033604_20230617T033631_049020_05E517_19DB.SAFE
Secondary Product S1A_IW_SLC__1SDV_20230629T033604_20230629T033632_049195_05EA64_3D65.SAFE
Are these displacements normal for such a region.
If not, how can I get more accurate vertical displacements?
