I’ve been reading this forum for the last few months and and confused by this. I haven’t seen any reference to the step of subtracting a value of a pixel you know has a change of 0. I’ve been following this workflow: https://rus-copernicus.eu/portal/wp-content/uploads/library/education/training/HAZA03_Land-Subsidence_Mexico-city.pdf and it does not reference that step at all. Can you elaborate? If I were to subtract some value from my entire image what exactly would that be taking out? Atmospheric effects? Change in the satellite position?
InSAR is a relative measurement. It generates a raster which tells how much a surface changed between two images. But the range of the result is relative as well, it has no absolute minimum/maximum.
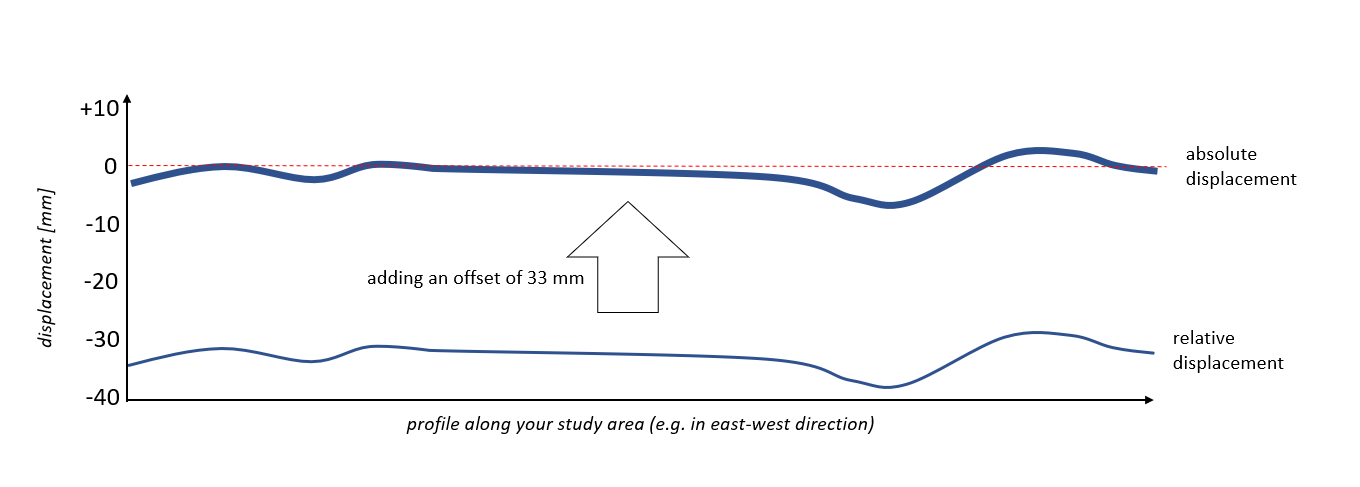
Consider the range of your result lies between -32 and -35 mm. Does that mean the entire study area sank down this amount? Not really. So you you look at your area and take one area which seems to be stable and read the displacement value. Let’s say it is -33 mm. So we add these to the entire image to level out the offset. Your new displacement image ranges between -2 and + 1 mm. These can be now understood as absolute values which represent what actually happened at each pixel.
How the threshold value is selected for masking out area with low coherence? I am working land subsidence on coastal area which is not vegetated but some sparse trees are present. most of the area is barren so what should be the coherence threshold value? please reply. Thank you
this depends on your interferogram. Low enough to maintain a consistent pattern of fringes but high enough to mask out areas with random patterns. You have to try a bit and compare the results.
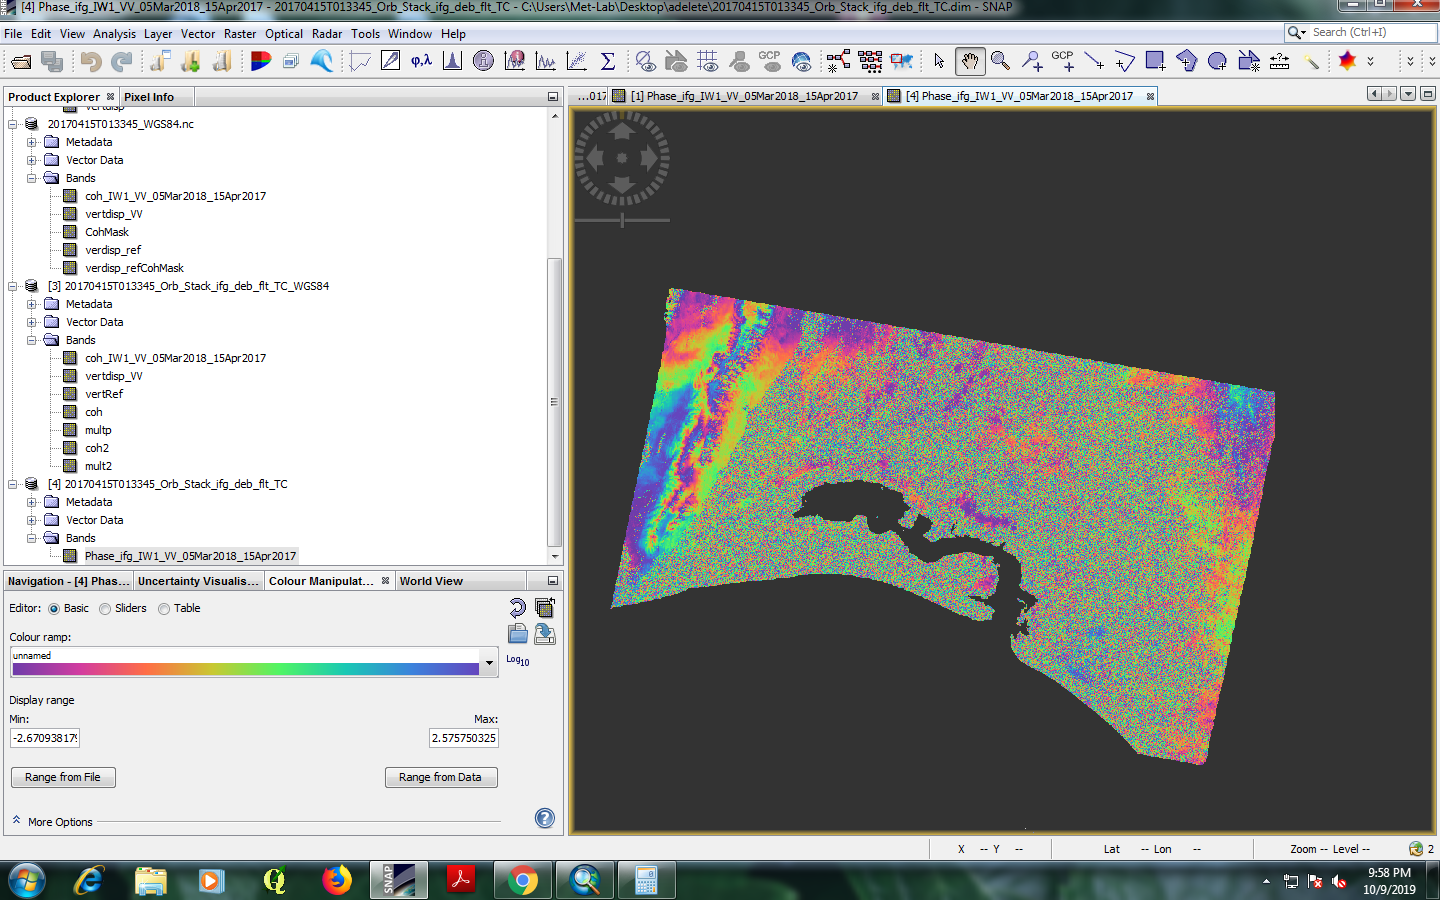
I can’t tell you the exact threshold of coherence, but based on this image, there is nothing to analyze in the center of the image. The parts in the west and east look like unwrapping could work.
How could we give you a recommendation when we don’t know anything about your case? We just see the image.
Based on your screenshot, you want to measure displacement from Sentinel-1 data. But where is your study area located? What is the landcover? Which part of the image are of interest to you?
At first sight I would say that the temporal baseline between your images is too high (April 2017 to March 2018). But InSAR results rely on so many different factors. For example, when the decorrelated area in the center is covered by woody vegetation, you will probably get the same bad results for an image pair with shorter temporal baseline because the signal often decorrelates within a couple of seconds/minutes over such areas.
Maybe you can specify your problem a bit. Please understand that there is no absolute solution in this field, one has to understand why the different intermediate products look like they are and how this could be improved. Starting from the size and landcover of the study area, coregistration, the selection of orbit interpolation for the interferogram, suitable phase filtering…
We are here to help you, but you need to help us as well
“Select a point where you assume no change and read the value”
How to select that point in the best way?
For example, in my case, working with ascending images with a temporary baseline of 12 days, 6 months and one year. I tried to find the point where there was no change in the image of phase to displacement, but I can’t find a good place that allows me to continue.
I was thinking about trying to find that point, using a profile plot, to try to see where the value of “zero” is.
Another question is about the change in values when the phase is converted to displacement.
What approaches the satellite has less phase and therefore the zones have negative values, but when the displacement is calculated, a phase change occurs, so a positive displacement indicates that they are areas that moved towards the satellite.
If most of your images are around 0, you can assume that your result is already levelled to zero. But sometimes, all the data is shifted by several centimeters or more and this makes little sense. So a profile plot is a good start. Another point is the overall pattern of deformation. It should not have a strong ramp over the entire image, this always indicates some coregistration or unwrapping error.
Thank you.
Reading the document that suggests to me, I see that the topographic phase was not removed. why?
and the other question; When generating the interferogram in the field of Coherence Range windows and azimuth, in small areas it is advisable to work with a size of 5 x1?
How does that size affect when generating the interferogram.
and in the parameters of the goldstein Adaptive filter exponent filter by default is 1, is it better to use 0.4 in small areas?
Actually, it does suggest to remove the topographic phase on page 11.
The kernel size of the coherence does not affect the interferogram, only the patterns of coherence.
About the phase filter, a large exponent is good for large displacement patterns, but a small one avoids errors in urban areas or areas with very fine fringes.
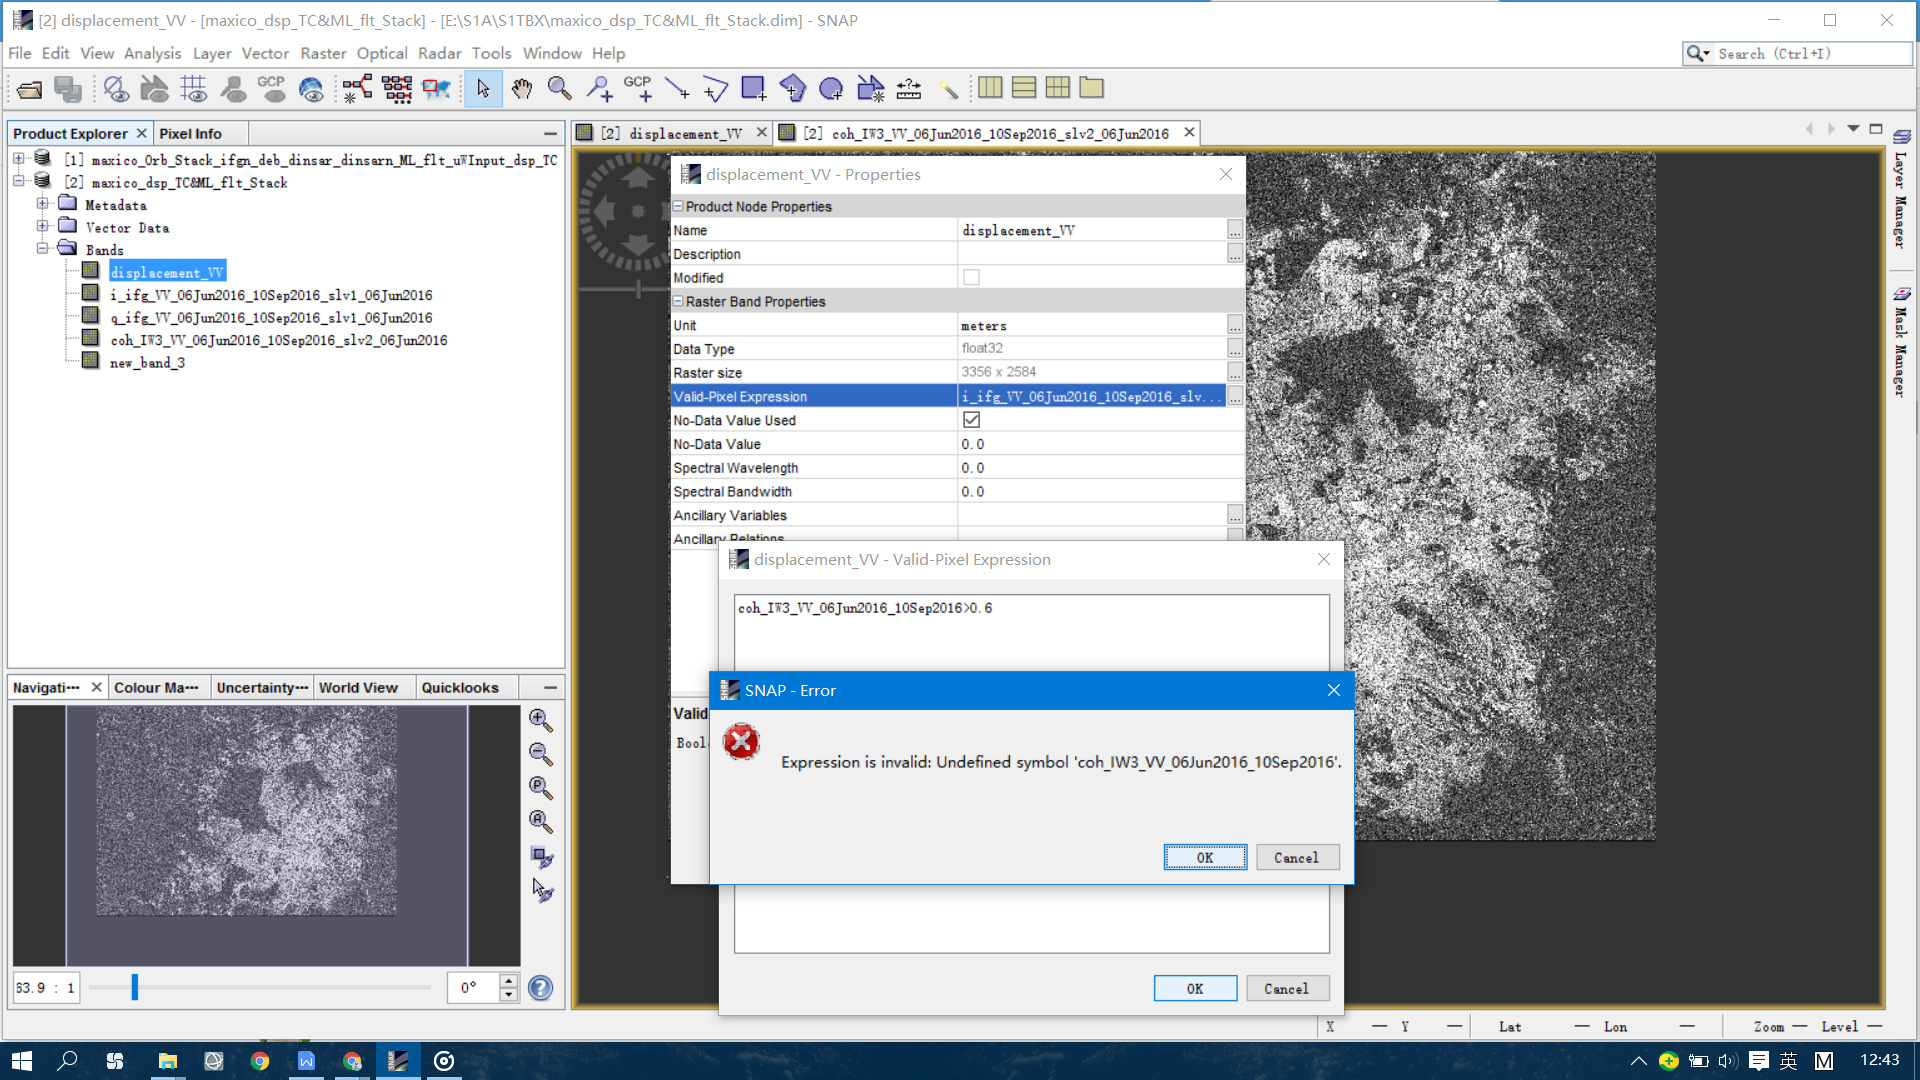
Wrong message appears again,why!after right click displacement_vv of new stack( displacement_vv and coherence of TC)stack_disp&coh|690x388 ,valid pixel expression.thank you for watching!
Firstly, you have to enter the full name of the coherence band in your current product. It continues with “_slv2_06Jun2016”
Secondly, you did not enter a threshold criterion, e.g. >0.3
I was following this conversation to understand after unwrapping, what equation can I use for converting unwrapped phase to elevation (deriving DEM) but I did not find any answer. Because this formula that you mentioned is for unwrapping to displacement and nothing for elevation.
I even asked my question here but nobody answer me.
Can you help me to know what should I use after unwrapping to derive elevation (DEM), if I want to use MATLAB or band math?

