Oh, cool!!! Thanks for your answer!!!
I found that differences between altitudes of a satellite at the moments of sensing the images were from 1.5 to 12 meters. But my points which didn’t change the elevation, have values about -200 millimeters. I am interested, how could it be.
if you are not familiar with the AOI, what is the best way to identify a reference point?
Good morning,
where can I apply " the reference height"?
Thanks.
you can subtract it from your raster in the band maths
Dear Tomcater,
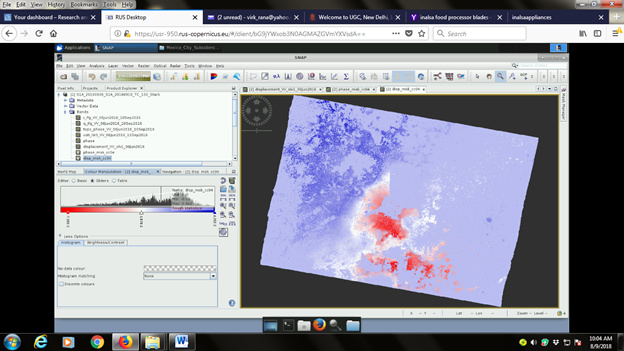
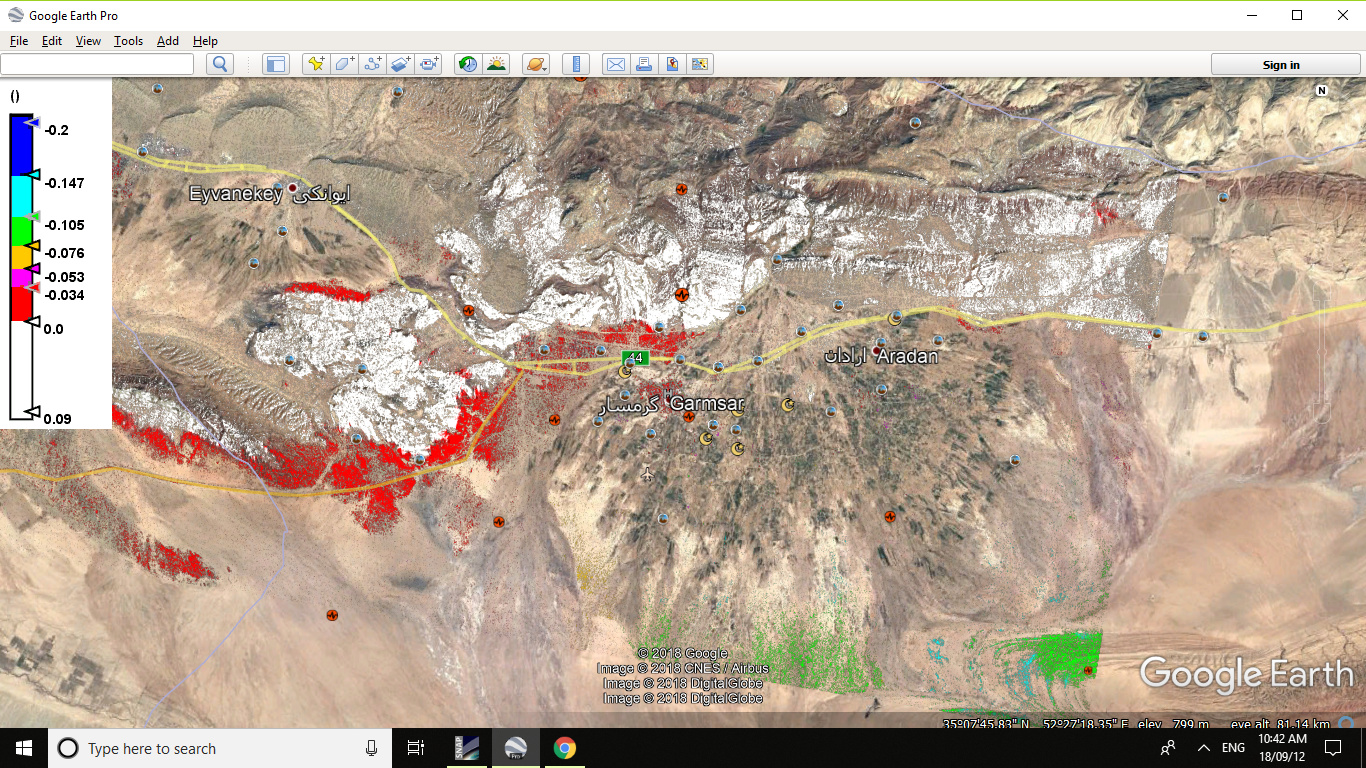
I want to mask out zero displacement area from this image.
Please guide how to do it?
Hi Virk_Rana,
Very nice map!
I would export it to GIS and mask out the values equal to zero. You could also make it in a more complicated way: export all the values from your region of interest to Excel, create a point shape-file for points with zero displacement, import the shape-file back. It should cover all the points of zero displacement.
Dear Abraun
i wish no change values to remain transparent and only displacement values to be visible.
In displacement map no displacement values are being displayed in white. When i play with transparency, other colors also loose their sharpness.
please explain.
regards
go to the color manipulation tab and switch to the table coloring. There you can define value ranges and assign colors (also transparent ones) to the different ranges.
Hi everyone
Positive means subsidence and negative signifies uplifting?
I have done the following steps to build maps of Uplifting and subsidence (map of displacement)
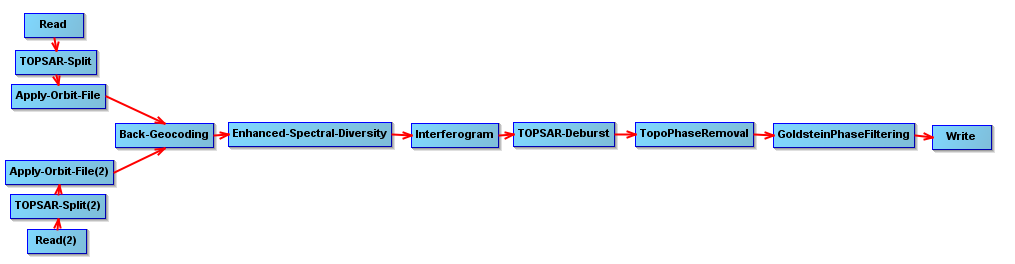
After completing the steps above, we performed the following steps:
1- Exporting data for SNAPHU processing
2-Importing results from SNAPHU processing
3- Phase to Displacement By Operator
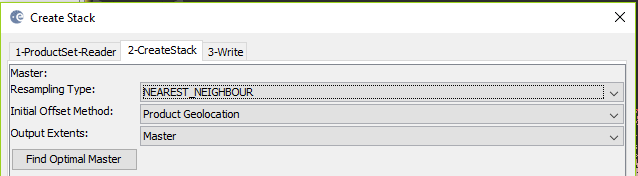
4- Create Stack (Coherence + Displacement)
5- Geocoding(Range Doppler Terrain Correction Operator)+Elevation
6- By Band Maths: Made DisUP35Coh & DisUP50Coh (Map of displacement that Coherence upper 0.35 and 0.50):
if (coh_IW3_VV_22Sep2016_31Aug2018 > 0.35) then (displacement_slv1_22Sep2016_VV) else (NaN)
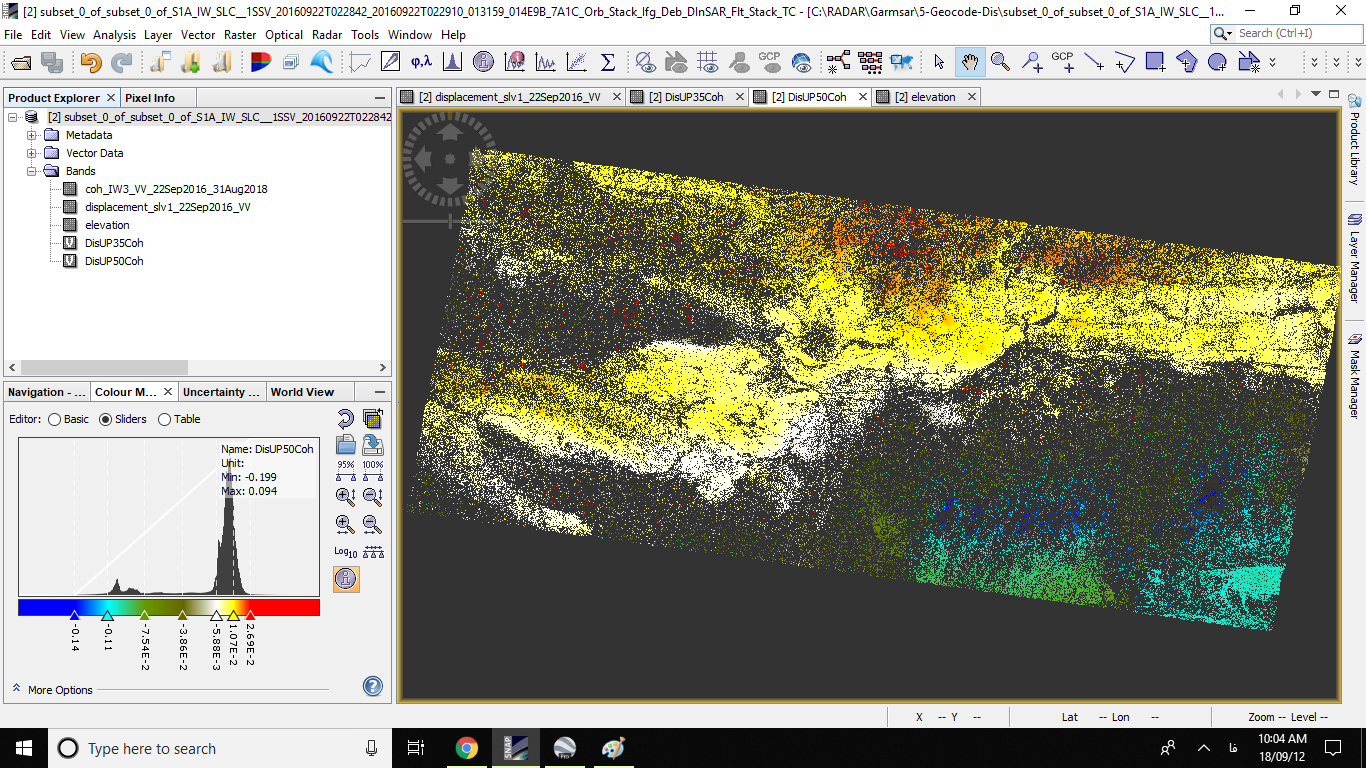
Track is Descending and other properties are:
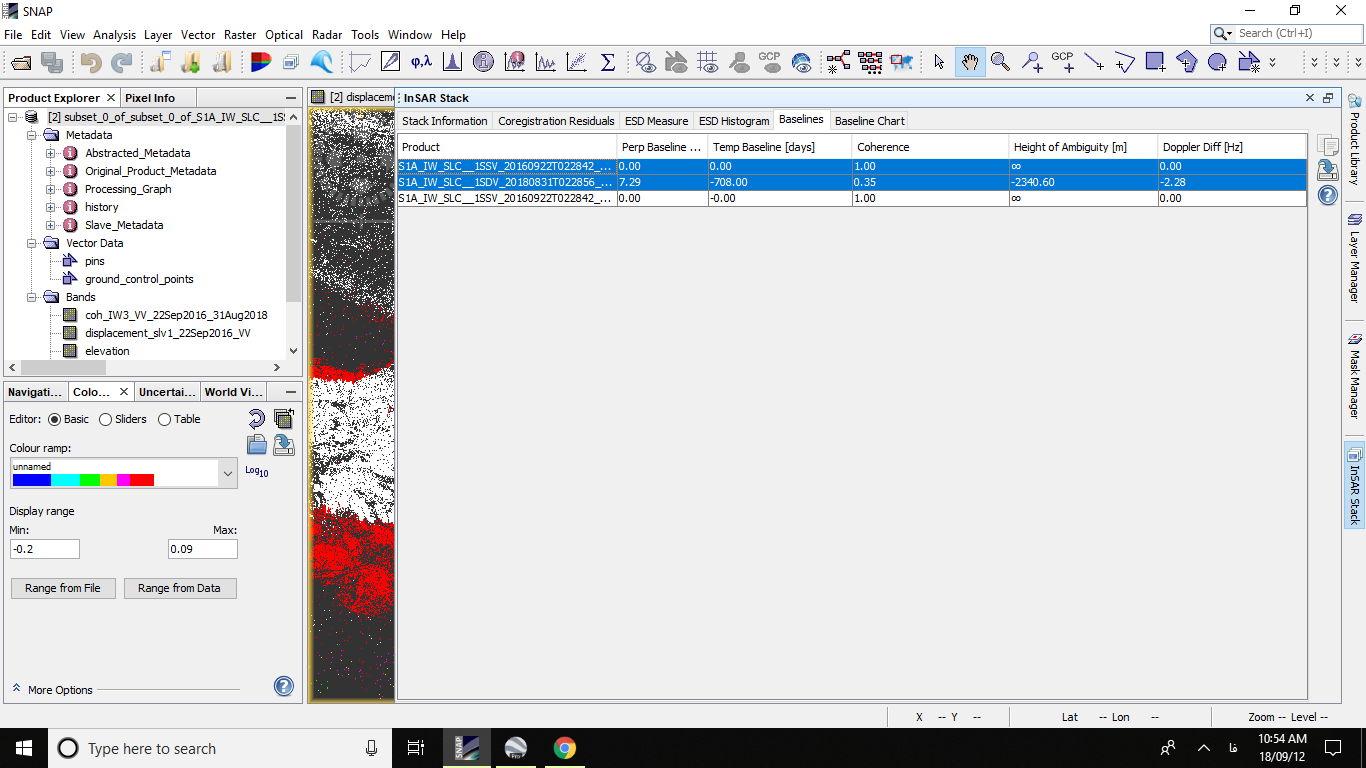
Now ,The question is: what is the positive and the negative in these maps?
Positive = Subsidence ?
Negative = uplift?
DisUP60Coh-Garmsar.kmz (2.4 MB)
Thank in advance
that depends on the date of your master and slave image. The difference indicates the change between both dates. But note that the map only displays the change along the line of sight, not absolute vertical displacement.
- Difference between vertical and LOS displacement
- Vertical displacement senitnel 1 interpretation
- Vertical and horizontal displacement
- The phase shift originates from horizontal or vertical displacements
Does the pattern make sense to you?
2 Likes
Very thanks ABraun
I have read the above, but this question remains for me!
I got the old image as masters and newer image as slave .
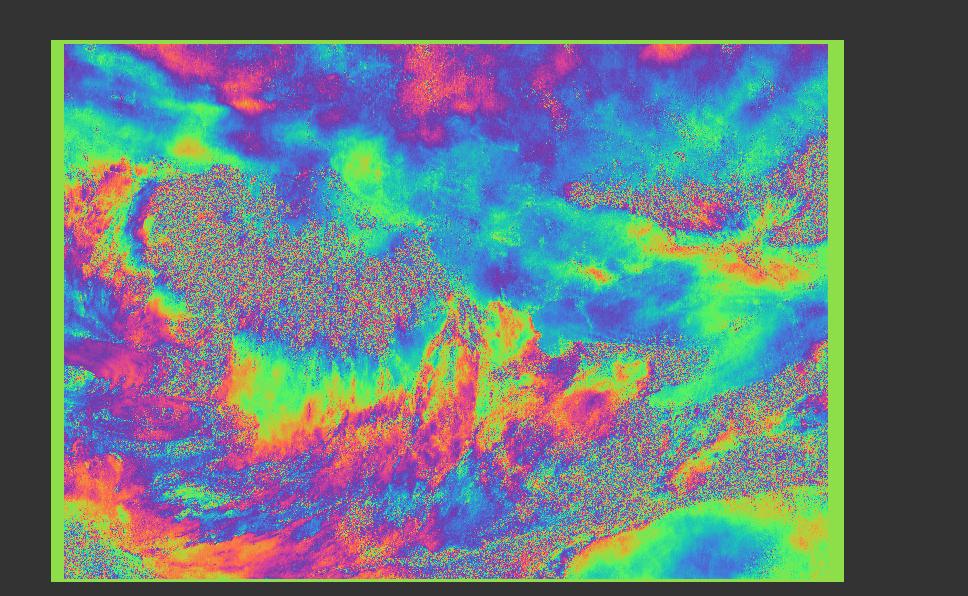
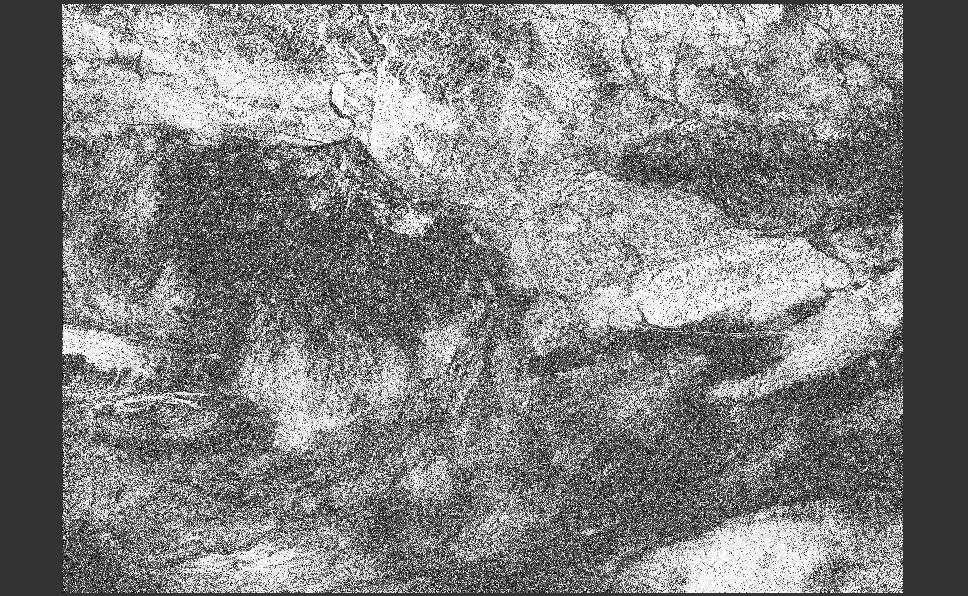
the phase and Coh are
IF phase converted to displacements and track be descending , the positive signal is uplifting or subsidence?
Thankful
Dear Abraun,
I am processing Landslide data but through DInSAR but couldnot found any reliable results.(Landslide events dated 13 Aug 2017 and 29 june 2018) at different sites with AOI in the same swath IW2 of Sentinel 1A images.
Wish to process a fresh from start. Would you please guide me if i share my location with you?
Like data acquisition, base line guidance, processing parameters and other related help.
Regards
sorry, I can’t grant to keep track of every step. What about the comments on your questions in other topics?
There are answers to almost any question in this forum:
- general workflow: Interferogram Formation - Subtract topographic phase check box
- full tutorial on subsidence monitoring: https://eo-college.org/resources/insar_deformation/
- notes on image selection and constraints: How can we calculate the volume of displaced material with displacement band(displacement_VV)?
- atmospheric disturbance: Subsidence Map
- InSAR - A practical approach: Have a look the comment on landslides in chapter 4.1.4
Because of the constraints (topography, surface change, atmosphere, long temporal baseline), many studies favor PS InSAR for landslide analysis:
- https://www.sciencedirect.com/science/article/pii/S0303243414000476#fig0010
- https://www.int-arch-photogramm-remote-sens-spatial-inf-sci.net/XLI-B8/55/2016/isprs-archives-XLI-B8-55-2016.pdf
- https://www.int-arch-photogramm-remote-sens-spatial-inf-sci.net/XL-7-W3/857/2015/isprsarchives-XL-7-W3-857-2015.pdf
- http://gfzpublic.gfz-potsdam.de/pubman/item/escidoc:2668888:5/component/escidoc:2672890/2668888.pdf
- www.mdpi.com/2072-4292/5/3/1045/pdf
If they leave any questions, feel free to ask.
3 Likes
Thanks a lot.
I successfully found subsidence in Mexico city where coherence is good. But in my area coherence is very poor. Tried temporal diff of 12,36,96 days but could not succeed. I feel DINSAR will not be helpful here.
I will check these docs and will keep on moving.
Hi ABraun,
Thanks for providing so many sources for us about INSAR and PS INSAR.
Here I have a question about both methods.
When we do D-INSAR, we can unwrap the phase and get the displacement using all pixels and then output the displacement results with high correlation coefficient which we considered the results more reliable.
When we do PS D-INSAR, my understanding is that we need to select Persistent Scatter first and then use their interferogram only to do phase unwrapping.
What do you think the difference of displacement results will be with D-INSAR and PS D-INSAR since we consider all phase for INSAR and only high quality phase for PS INSAR when phase unwrapping?
Best,
Xianwei
1 Like
basically yes. But if the areas of hígh coherence are not connected in the image, unwrapping errors might occur which falsely add up the fringes in the image.
yes, PS are selected based on their temporally stable amplitude. Then, interferograms are computed only for these areas.
as said, in traditional DInSAR, all pixels are included in the unwrapping. if you have a larger region with high coherence (e.g. desers, urban areas, or few vegetation), this works fine. If you have only small patches of high backscatter (and coherence) PS InSAR might be the better choice.
Some of the pros and cons are evaluated in this review paper: https://www.sciencedirect.com/science/article/pii/S0924271615002415
These article also compares both methods: https://ieeexplore.ieee.org/document/6350555
Thank you for your reply. I will further look into this.
Andreas, how did you overlay the coherence mask on the displacement map? Thanks
you either define a nodata value in the properties of the displacement map or you add both rasters to one view with the layer manager.