Subsidence Map

if you want to exclude zero displacement areas, formulate your valid pixel expression as follows:

displacement_VV > -0.01 AND displacement_VV < 0.01

Play around with the thresholds to find out the perfect ones. Optionally, include coherence:

displacement_VV > -0.01 AND displacement_VV < 0.01 AND coherence > 0.6

This, however, requires the coherence to be in the same product.

I have found Subsidence with 0.6 coh threshold. Showing -7.6 cm subsidence and 2.8cm uplift.
Please justify uplift? is it due to some errors?


Regards
ASVirk

One another area results are here. DInSAR taking two images with 36 days temporal difference.
Shown subsidence and uplift.
Please help me to understand the phenomenon.
Subsidence is at uphill and uplift if in the bottom of hills. Is it due to the fact that snow from top has melted and accumulated at the bottom? Snow starts melting from April to August each year. (Images taken in the month of may and June)

the extreme values do not matter the most. It is important that the general pattern of your displacement makes sense. The mimimum and maximum displacement values often are produced by atmospheric influences or unwrapping errors.

As for your second example: Is it a coherent change that is expected? That means did the surfaces change their properties in any way (besides their elevation)?
I don’t know any of your study areas and cannot judge if the results make sense but your second example looks like there is a ramp in your data between the eastern and western part. It is always good to look at all steps of the processing. Does the interferogram look alright?

2 Likes

Surface change due to snow accumulation or melting only.
Landslide was there on date 28th June.
I will be covering this date in next processing.
Plz see Interferogram

Both snow melt and landslides are primarily non-coherent processe, thant means the surfaces change their backscatter characteristics and the pixel information is out of phase. This makes them unsuitable for differential interferometry.

Have a look at mengdahls explanations here: How can we calculate the volume of displaced material with displacement band(displacement_VV)? (this post and two below).

Sometimes, the fringes you see in your interferogram are heavily affected by atmosphere. I cannot tell what is the case in your study because I don’t know the area and the dynamics.
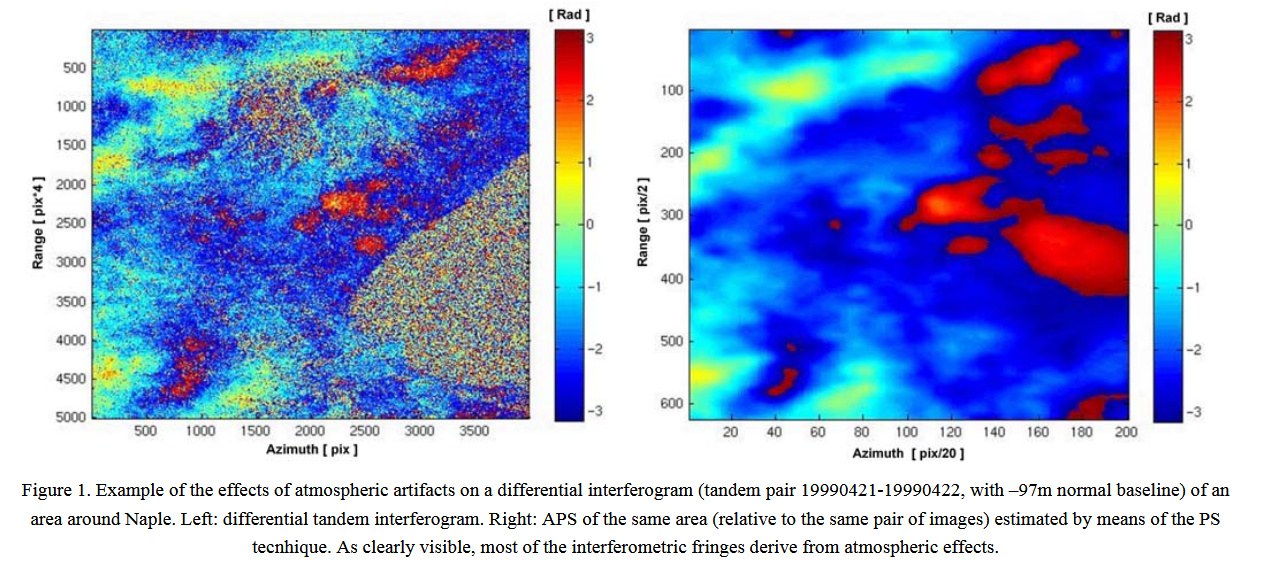
Have a look at this example, where the inteferogram is compared to the atmospheric phase screen (APS), an estimation of the influcence of atmosphere on your data.
What looks like nice fringes on the left turns out to be predominantly caused by atmospheric disturbance (right). It is therefore often a good idea to calculate interferograms of multiple image pairs to see which patterns persist and which are random.

Source: https://www.researchgate.net/profile/D_Perissin/publication/224713337_Accurate_DEM_Reconstruction_from_Permanent_Scatterers_and_Multi-baseline_Interferometry/links/00b7d51470b2ec7046000000/Accurate-DEM-Reconstruction-from-Permanent-Scatterers-and-Multi-baseline-Interferometry.pdf

Where should we fix reference point (A pixel point assuming no deformation at it have taken place) to subtracting its calculated displacement value from all displacement values.
Coherence should be high or low for this point?

I honest cannot tell. These are relative displacement values and one has to consider the nature of the study area to select one.
Have a look at the displacement pattern and select a point where there is not much dynamic.

But high coherence is also a good thing to look for.

Well, coherence should be normally high or very high as it should represent no/minimum change.
It is kind of an assumption to assume stability for that point, but I suggest to use points close to permanent GPS stations or so, as you can know the real behaviour of the seleccted point.

You could find many papers with more information about the ref point selection, always it is better to estimate having large datasets where the temporal variabilities can be computed. Or sometimes just select a known point, with known behaviour (CR) or known geomorphology… etc

i found solution for masking low coherence.
when i generate phase mask band by band maths:
mask=phase * (Coherence >= 0.4)
it shows low coherence but when i mask coherence first and then multiply it with phase, it got masked.
dont know why it show different result.

One more question dear mdelgado and ABraun;
i have generated 5 interferograms by two pass DInSAR processing single swath and single burst of S1A and found deformation individually at some high coherence points.
I wish to combine these interferograms and then proceed for displacement detection.( I mean i want to club all deformation results)
How can i do it?
Will averaging the coherence and Phase work? and would it affect phase unwrapping?

the easiest way is to select single representative points and retrieve the subsidence at these locations and put them into a temporal context. Have a look at these materials, especially the last slides which combine different interferograms for a temporal subsidence graph: https://eo-college.org/resources/insar_deformation/

Well, apart from the fact of questions… why only 5 interferograms?
If you only have few images, you could try to apply the double-differences technique. For doing so, you need to pick up a reference point near by the subsidence area so the atmosphere could be neglected and assume that is the same than for the selected reference point.

See works that apply this technique such as:

  1. http://citeseerx.ist.psu.edu/viewdoc/download?doi=10.1.1.566.7877&rep=rep1&type=pdf
  2. https://earth.esa.int/documents/10174/1566998/Mahapatra_Fringe_presentation.pdf
2 Likes

You can also try the Integer Interferogram Combination module in SNAP

why? it is ?

It is also my problem why???

please describe your problem a bit clearer. What data are you using and why are you not happy with the results? You can include screenshots to illustrate it.

Is it possible for an interferogram to have high coherence, but no fringes? should he also consider if there are fringes in the interferogram?

yes, both is possible. Coherence can be high but still yield in noisy inteferograms. For InSAR, the quality of the interferogram is more important.