Dear all
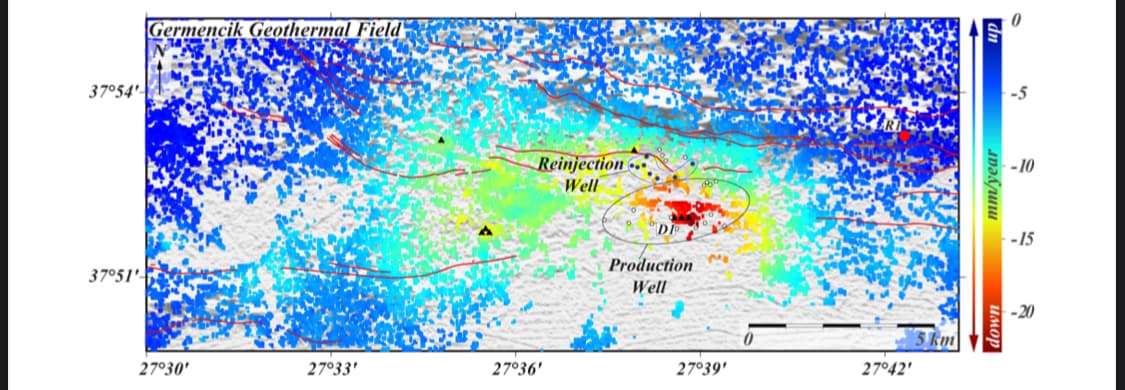
My topic is to calculate the deformation(substance and uplift) that occurred in the oil field from (2014-2022)
So I took data for December and July
And January every year
(Sentinel 1 slc iw )
For example, the data for the month of December for the year 2018 is
1- S1A_IW_SLC__1SDV_20181219T145036_20181219T145129_025096_02C520_2AD5
2- S1A_IW_SLC__1SDV_20181231T145036_20181231T145129_025271_02CB72_6FE1
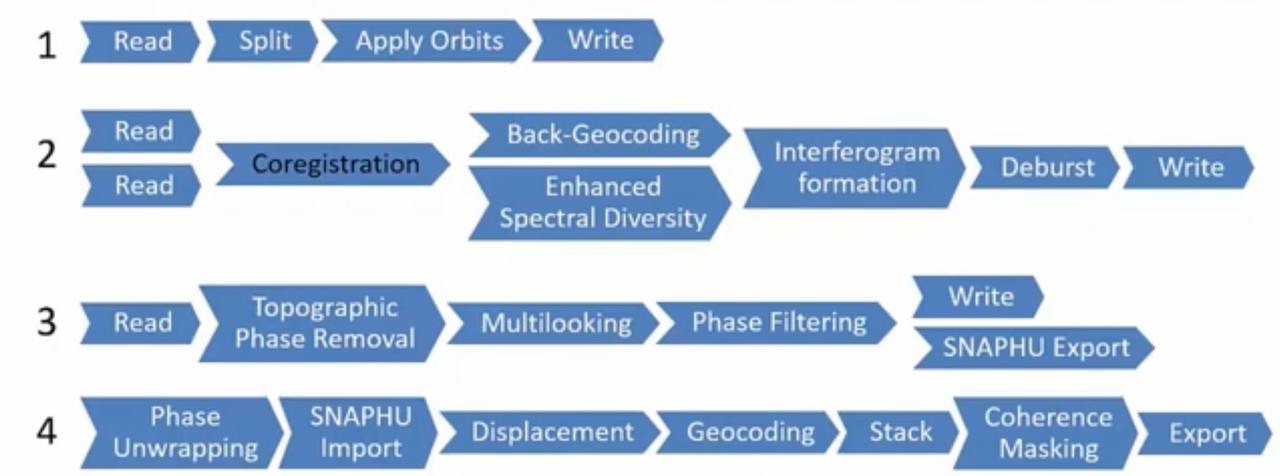
then I made the following steps in the Snap software
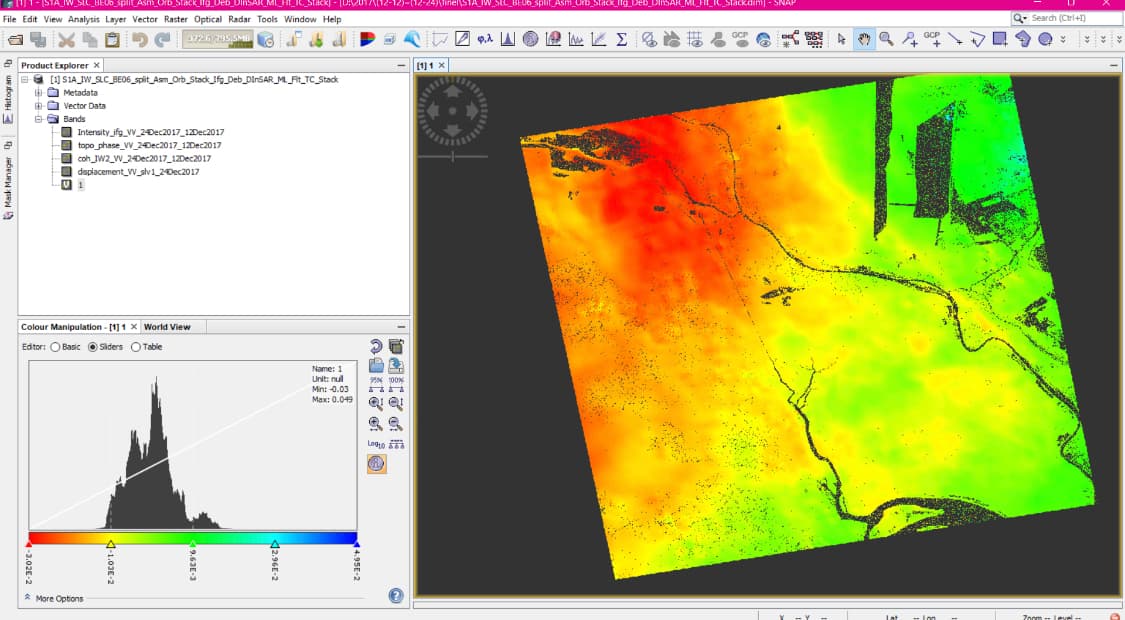
After that I have got
1- In snap
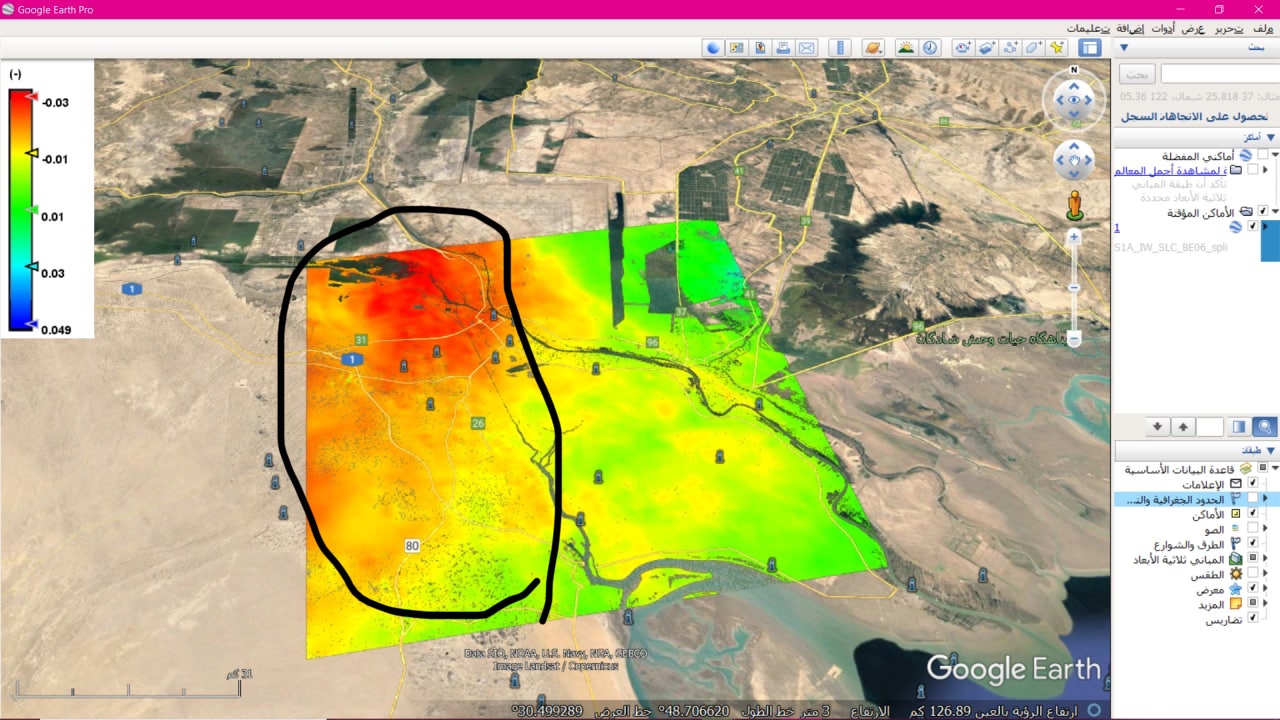
2- In Google Earth
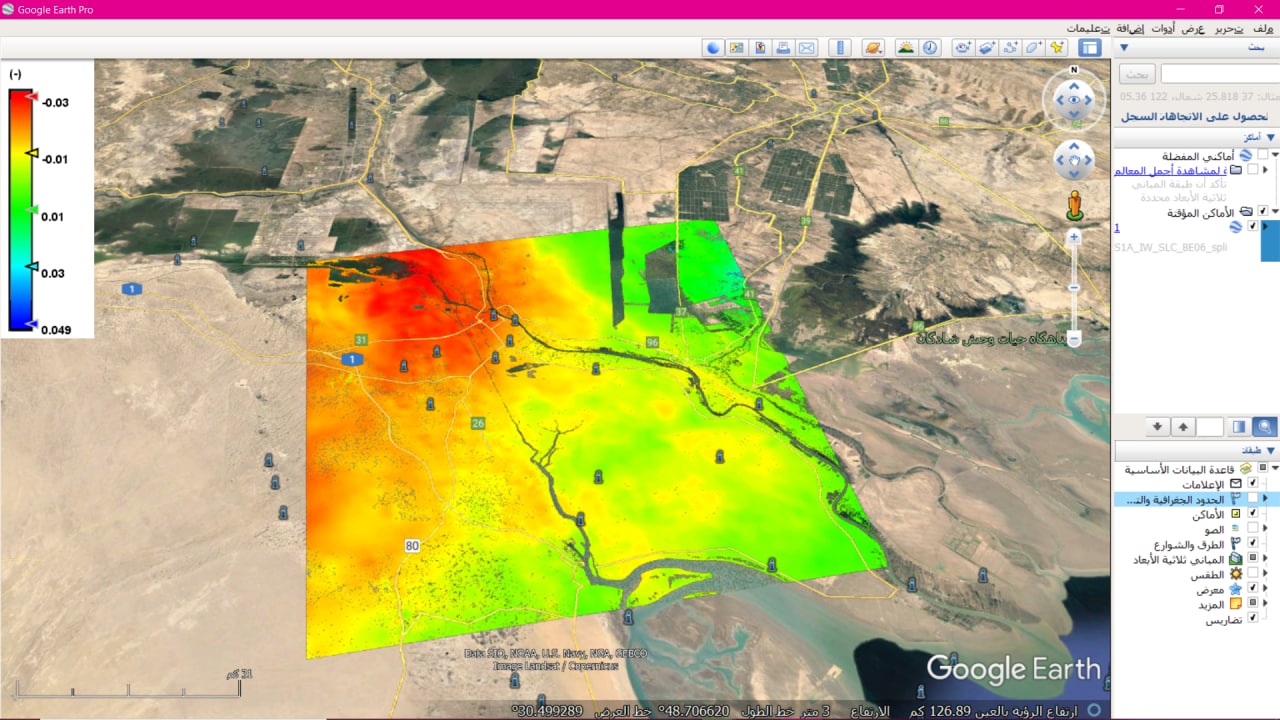
The selected area is the study area
Questions I want to know the answers to
1-What does this scale represent?and
What are the units of this scale?(mm.cm.m.km)
2-How can I calculate the subsidence in the study area for all years
3-How can I show the final results for each year like this, knowing that I am using windows 11
4-Is the method I used correct?
5-Is the data I took for each year sufficient or do I have to take data for each month of the year
6- Is Windows enough or should I analyze the data with Ubuntu?
I really need your help ASAP
I need your advice🙏
Best regards