Can anyone one please tell me how to perform SVM in sentinel 1A data using SNAP
1 Like
SNAP toolbox does not support SVM classification. If you want to perform a supervised classification in SNAP, you should use Random Forest.
Thanks a lot for your reply. Actually i am new so can you please tell me step by step procedure to perform Random Forest Classification in SNAP.
The steps are the following:
1. collect training datasets as shown in the figure below (either using polygon drawing tool from SNAP or using QGIS to draw polygons in shapefile format)
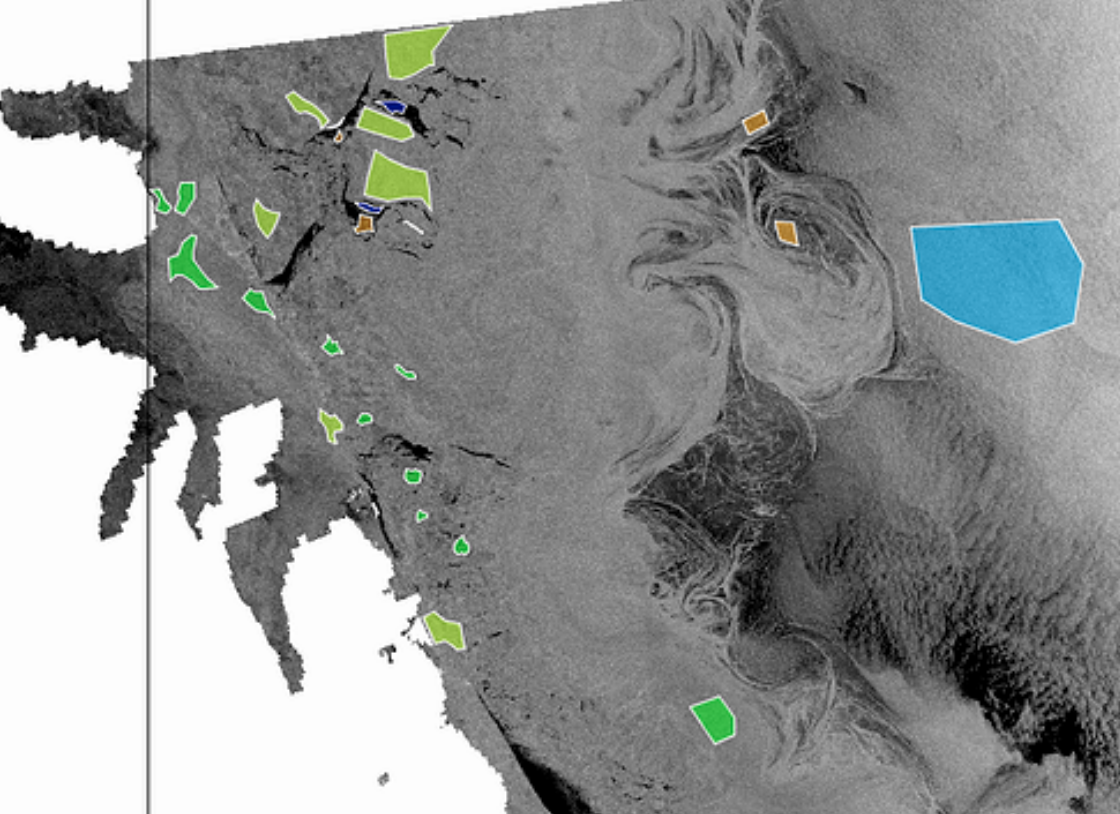
Figure 1: trining datasets on sea ice types
2. raster-> classification->supervised classification-> random forest as shown in figure 2
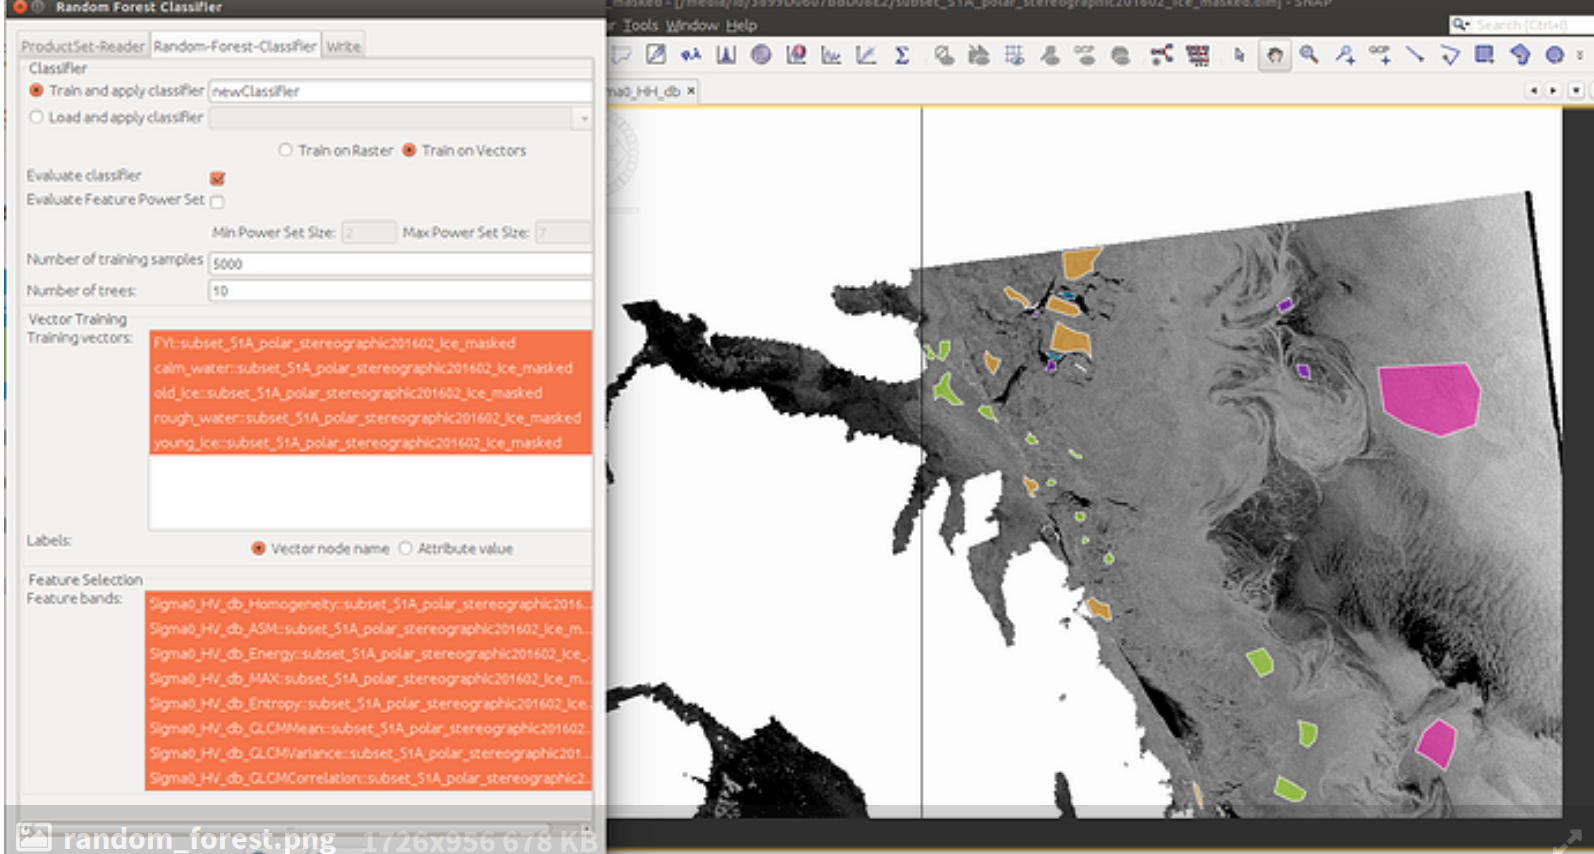
As you can see, on the top, ‘train on vectors’ is selected. This is your polygons you have created for each class.
In the first box (vector training), you select your vector data representing your classes and on the second box (feature selection) you select the SAR bands.
Good luck
2 Likes
Dear sir
Actually, i want to identfy the paddy crops and i have 50 ground-based GPS point can i used these as a training set??
Hi Ranjan07,
The quality of your training data play an important role for the classification results. poor training data results in poor classification results. Preferably, when collecting training data, each class should be composed by many many pixels. For this to happen, you need to create polygons representing each class. By having points (as training data), this means that each point correspond to one pixel only. Hence, you should have a great amount of points covering each class to ensure that you have enough data for your model to train.
To answer your question, yes, you can use your GPS points are training data but 50 points are not enough for the model to perform an accurate classification.
The higher the number of training data the better
2 Likes
Dear sir
One more question. I want to identify paddy crops using Sentinel 1A data and i have 50 ground samples. Can you please tell me technique which is favourable for it.
Using SAR sensor to perform a crop classification is relatively difficult job due to the sensitivity of microwaves into surface roughness. The majority of crop types appear as rough surfaces for SAR, hence, the backscatter signature for each crop type is similar and their discrimination is challenging (even with dual-pol data).
In your case, in order to identify paddy crops, we expect a lower backscatter intensity compared to crops that are not flooded. If you create a color composite image from your data, paddy fields should be relatively easy to identify.
The optimum way to achieve your goal, is a combination of optical (SENTINEL2) and SAR image.
Another way to improve the classification results (and hence identify the paddy fields) is to perform a texture analysis on your SENTINE1-1 image(GLCM which is implemented in SNAP) and combine the GLCM results with the SAR image
2 Likes
very well explained by johngan!
I think if you have GPS points with locations of paddy crops, you should somehow add another 50 points at locations where no paddy crops are expected. Having these 100 points, you can calculate a small buffer around them (GIS) in order to include a bit more pixels. Then you use these 100 polygons for training the classifier as explained above. They should have an attribut column with 1 at paddy and 0 at no-paddy, for example.
Importing shapefiles in SNAP is explained here: Can't import vector data
But the suggestion about the color composite of a dual-polarized scene is a good start to get to know what SAR data is able to offer for your analysis.
1 Like
Dear sir
Thank you so much for your warm response
Thank you so much for valuable response.