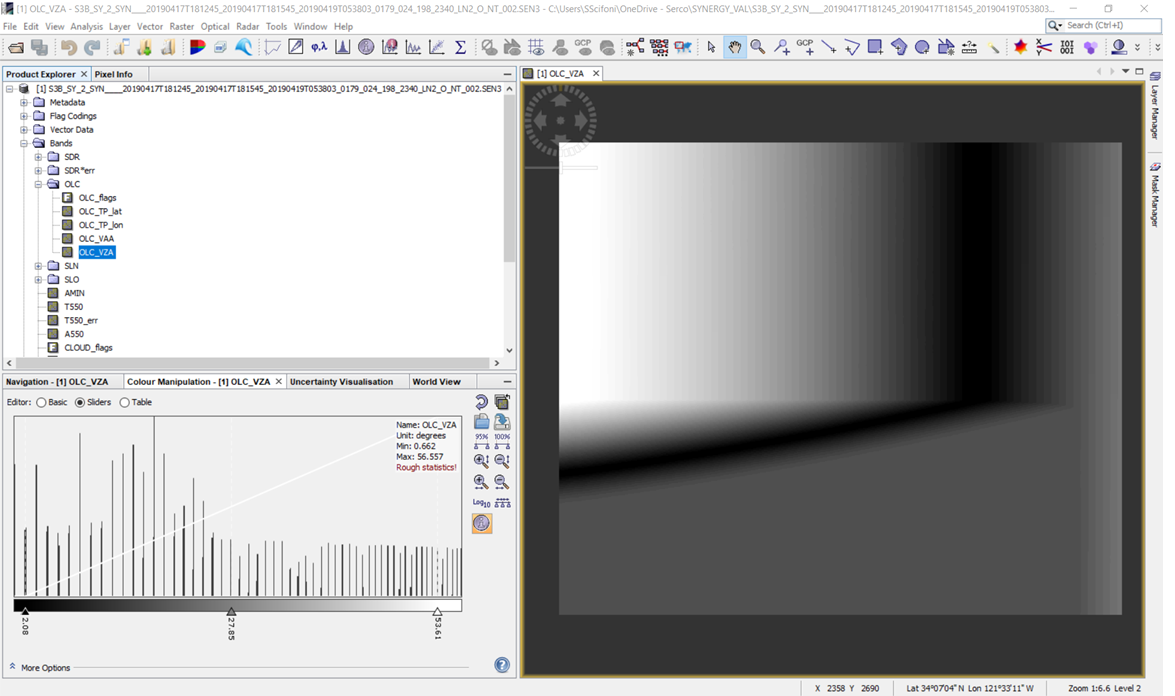
I noticed that some Synergy products show corrupted bands (for example OLC_VZA, OLC_VAA, etc) like the attached image. It seems to be related to SNAP display, because opening the same products with others tools, I don’t observe the same issue.
Hello Silvia,
can you tell us which other tools you used to view the data?
For that particular band you show in your post, the issue seems to be that no data is available for the lower part of the image, so I wonder what other tools show in that area.
I see. the difference is that Panoply handles the data from the .nc-file independently from the rest of the SYN product. It either displays the data in a 1D-array or plots it according to the geo-location given in the .nc-file.
SNAP uses the geo-location from the SYN product (from geolocation.nc) and fits all bands to that grid. Therefore you have different images.
thanks for your answer but if you open other synergy products using SNAP you will see that there is not the “strange effect” as in the lower part of the image that I posted, but you will find only vertical lines that is the correct way to display this data.
The data coverages for the OLCI angles do not necessarily cover all of the area from the SYN product extent as described in geolocation.nc. For some SYN products this will work, and there you will see your expected result. For others, such as the one in your original post, data might be available only for some parts and SNAP attempts to interpolate to the parts without data.