Dear friends,
I am using one of images Tandem_x. I want to compare histograms before and after logarithmic operations, for HH-channel.
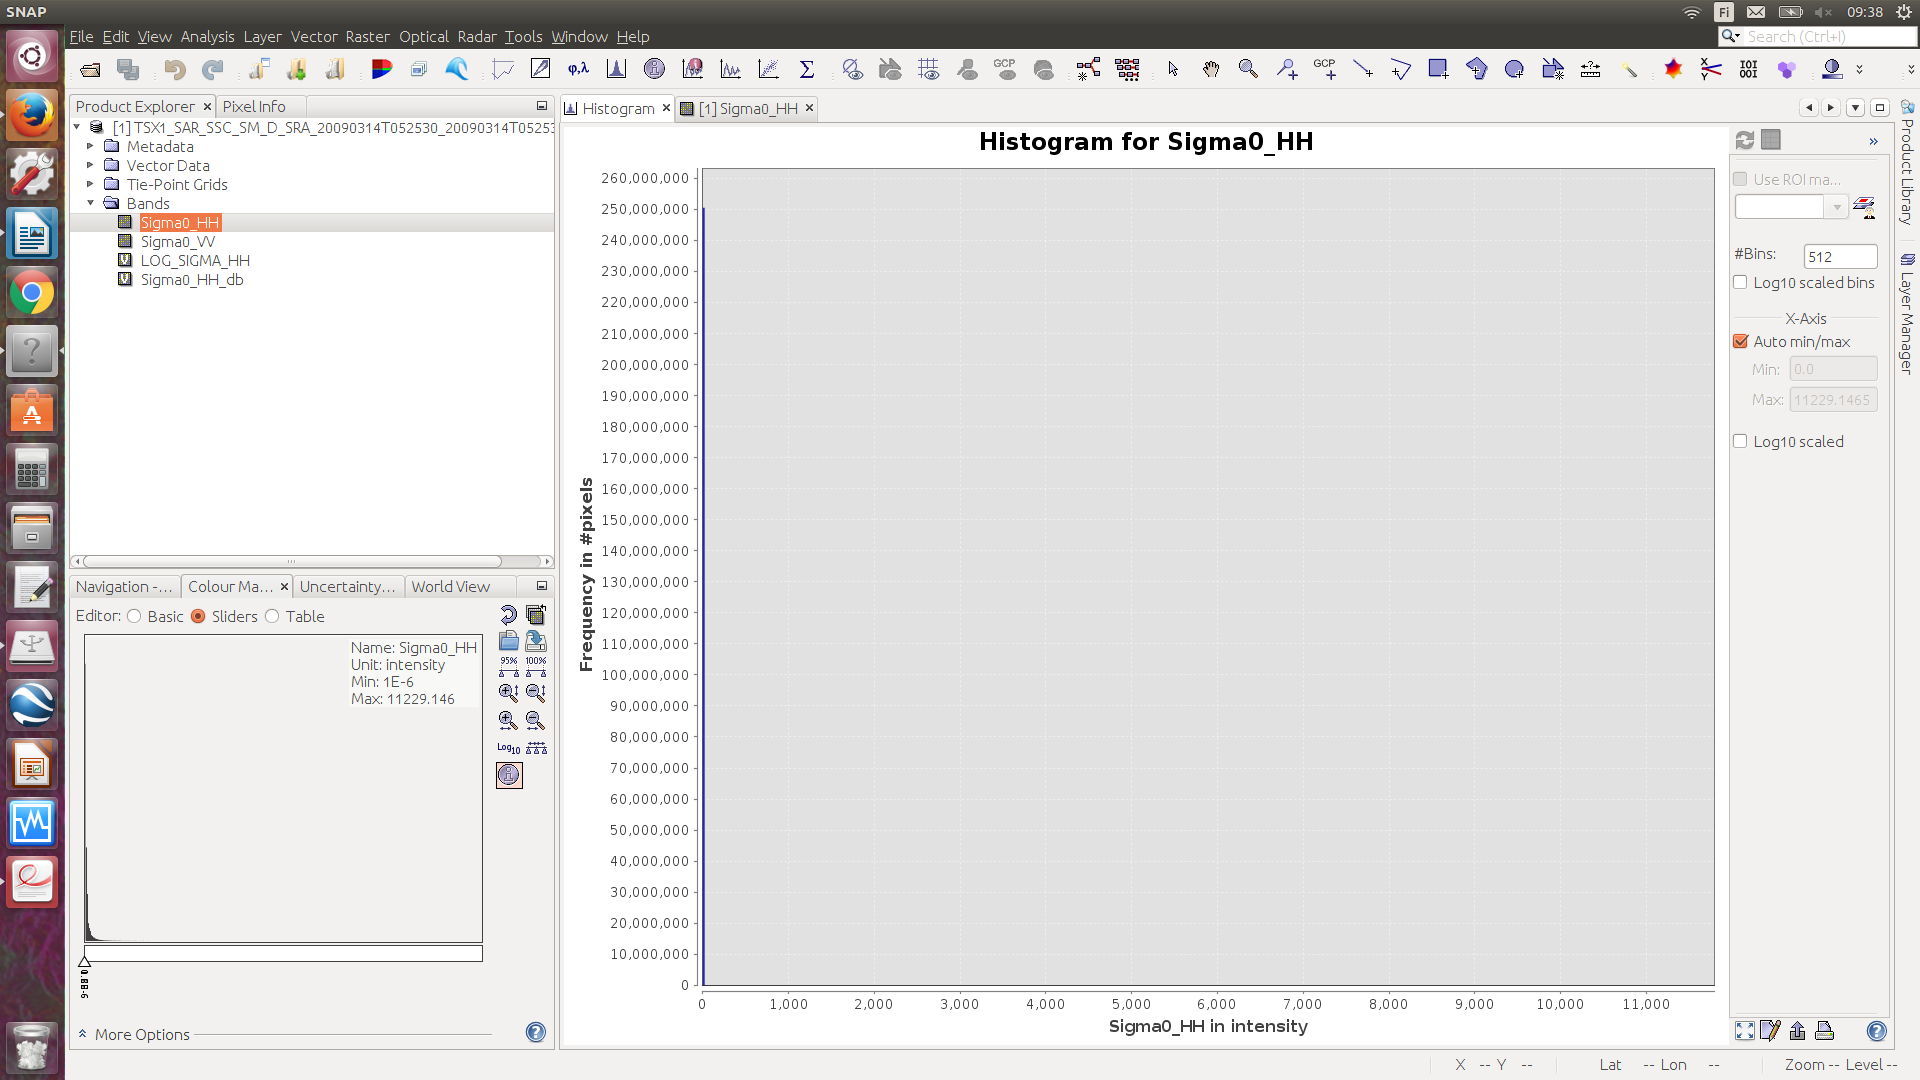
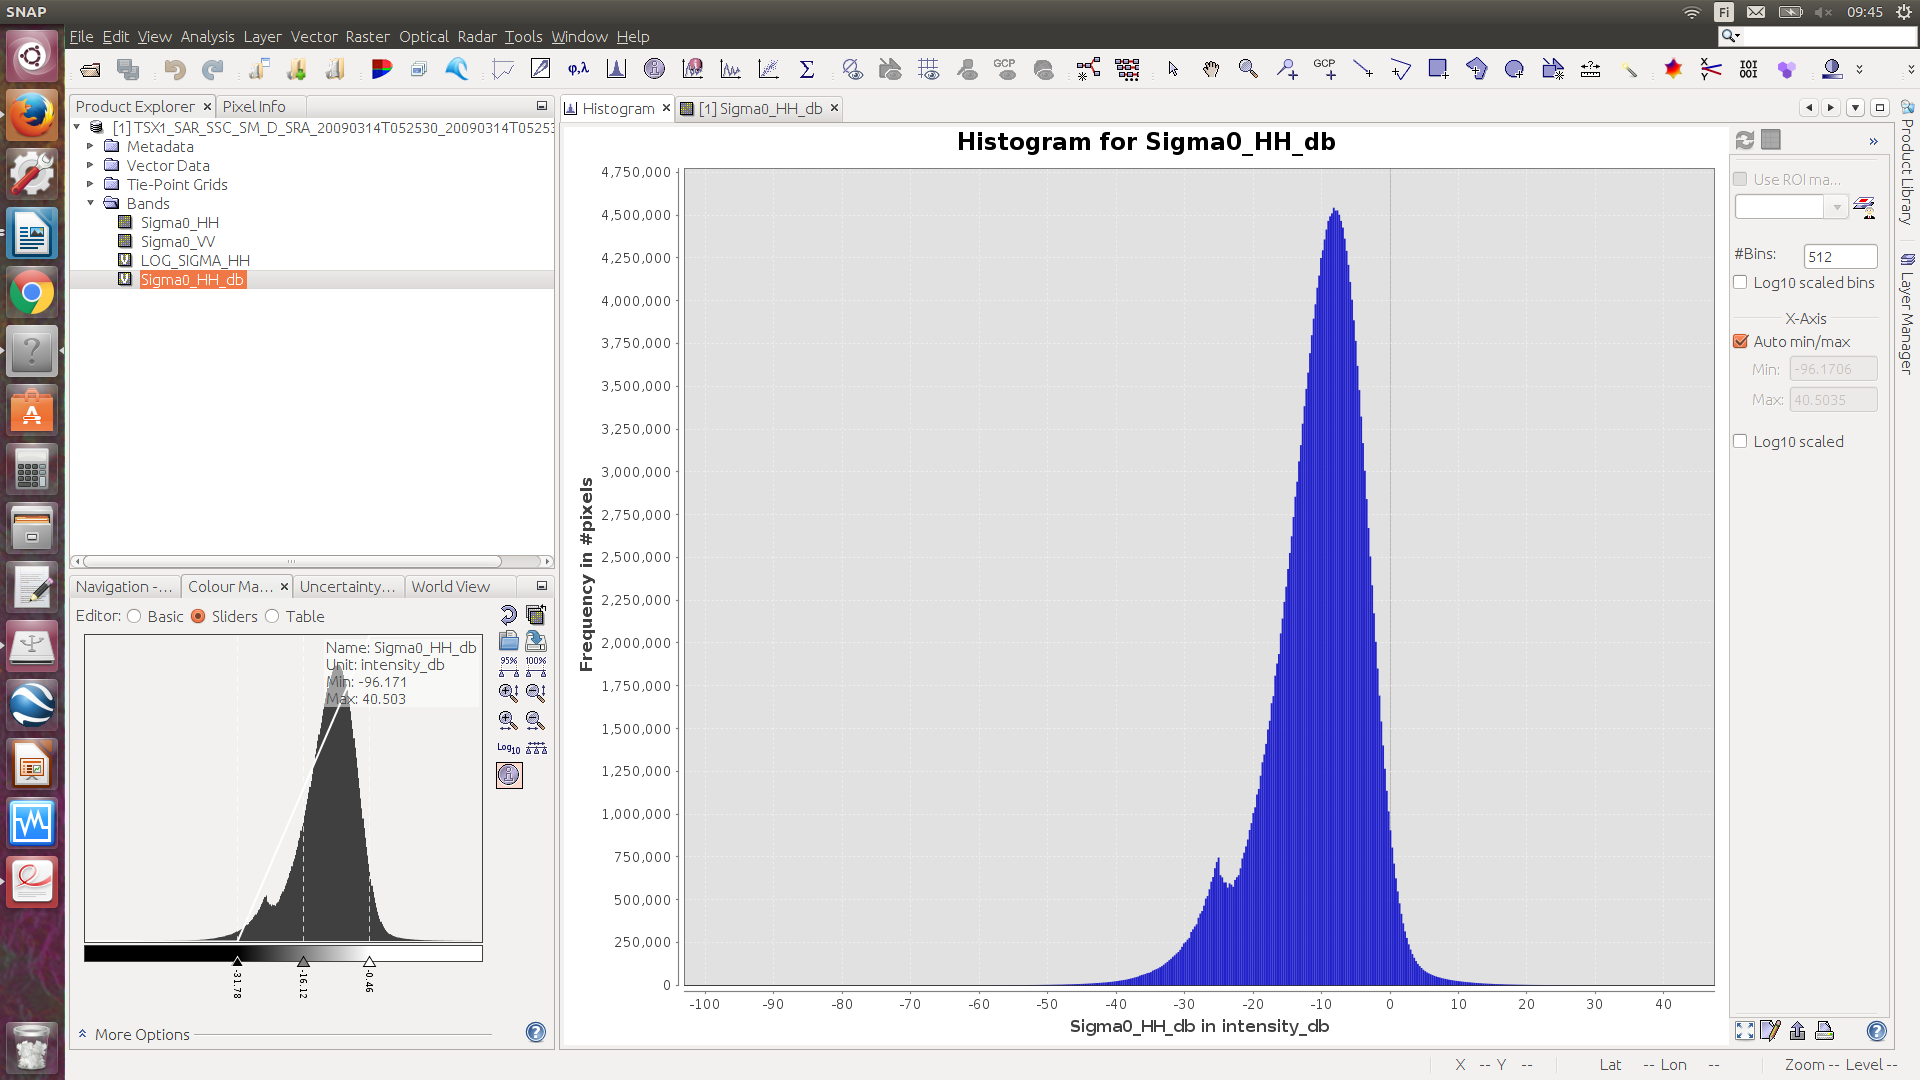
I got good result for logarithmic operation but I do not know why I can not show histogram before logarithmic operation?
It shows like below. I changed auto min/max but I did not find any differences.
Please guide me in this issue.
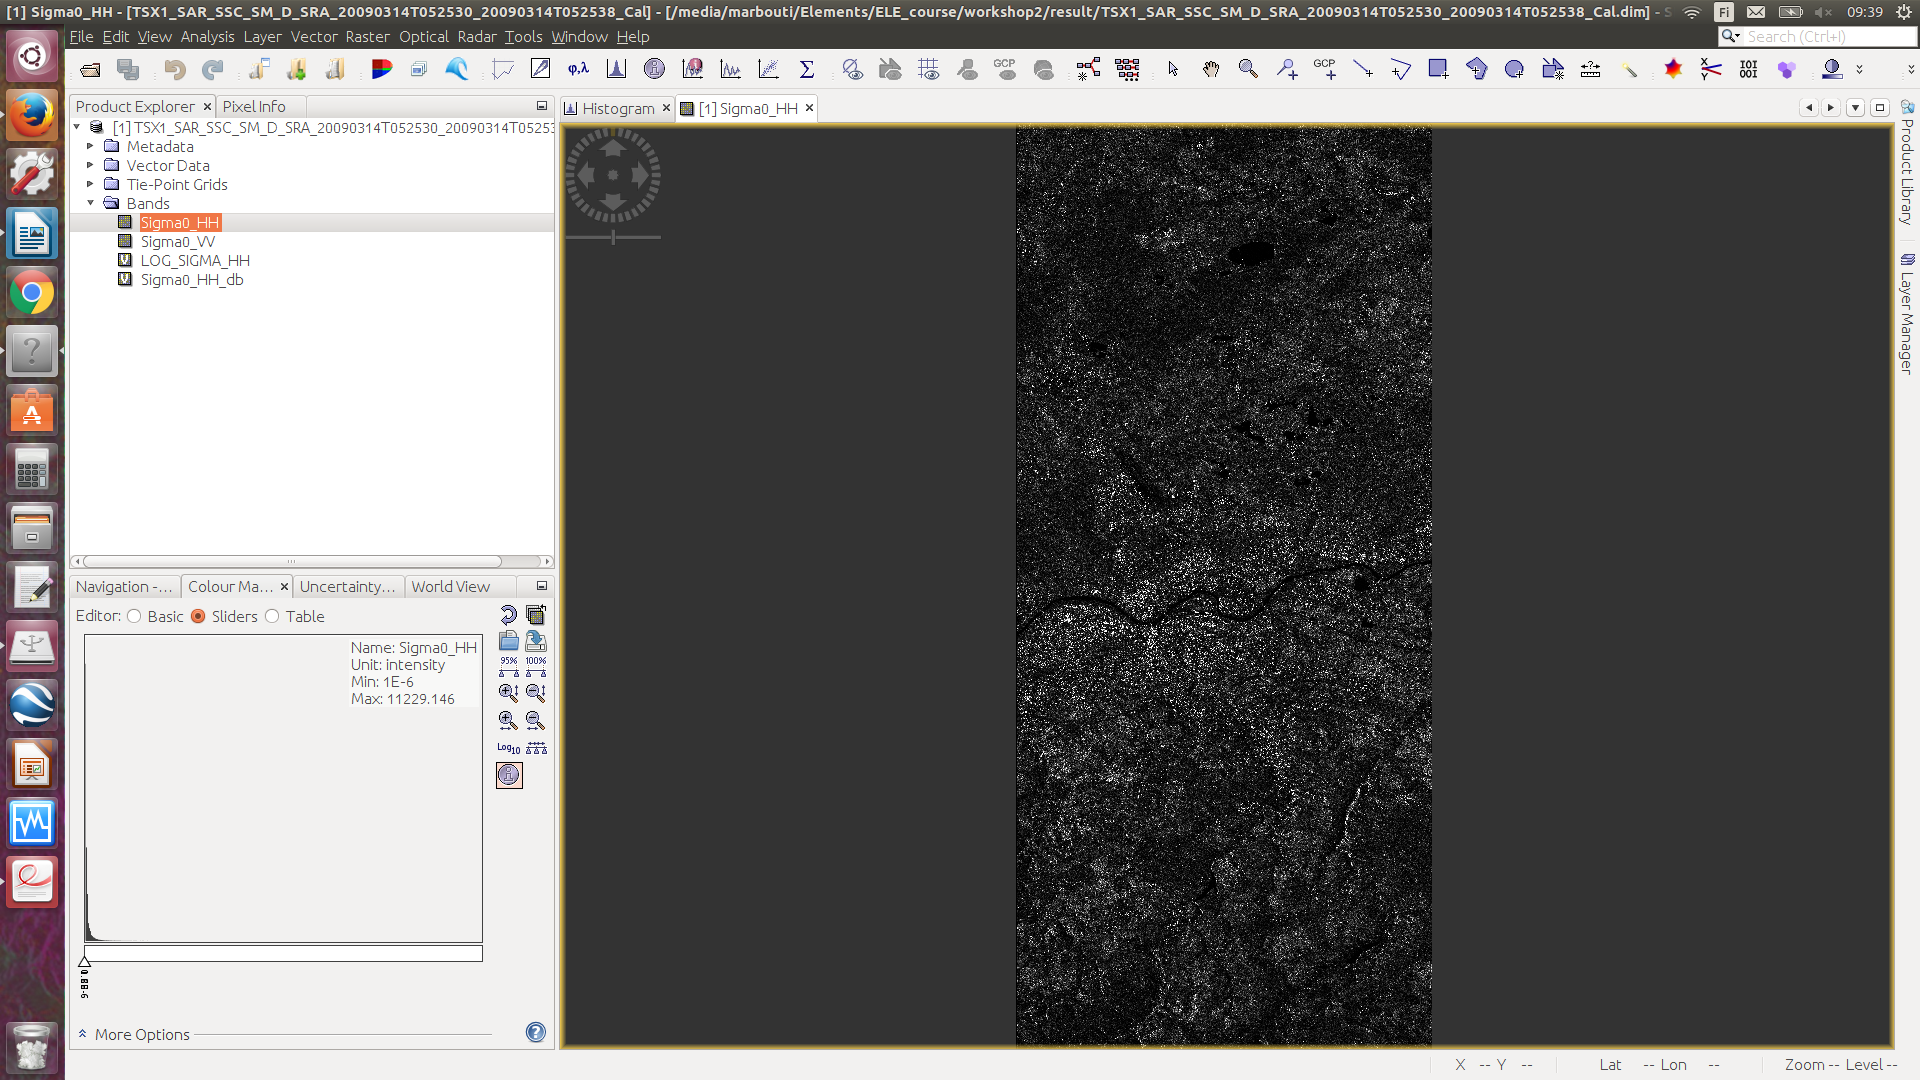
Histogram before logarithmic operations, for HH-channel.
the signal in power scale concentrates on very low values but can have an extremely wide range. This is exactly why logarithmic operation is applied on the data. It stretches small ranges and shrinks large ranges.
You can use the statistics tool on it to get the value ofthe 95% percentile (or even higher). Use this as the maximum for your x-axis instead of an automatically derived ones.
An x-axis between 0 and 5 is probably sufficient.