The Order of DEM Creating Steps

please see here: Proccessing SAR images

Hi,

where can I find the tutorial that you have linked? Is it on Amazon AWS?
Thank you very much!

it is now located here: http://step.esa.int/docs/tutorials/S1TBX%20TOPSAR%20Interferometry%20with%20Sentinel-1%20Tutorial.pdf

2 Likes

Hi!

I am trying to create a DEM of Nassiryia area. I know that the baseline is not ideal for realizing a DEM (i.e. 53.48), while the coherence is reported in the histogram:

I have applied the following steps:

  1. S1 TOPS Coregistration
  2. Creating Interferogram
  3. Debursting
  4. Goldenstein Phase Filtering
  5. Multilooking
  6. Exporting to Snaphu, unwrapping and importing back
  7. Phase to Elevation
  8. Range-Doppler Terrain Correction

Finally I have obtained these 2 DEMs:


As you can see, they are quite different, but the second one is the real aspect of the topography. Also, I have compared the second output (i.e. bands=“elevation”) with the elevation in Google Earth, but the two data are different. Could is it a problem caused by wrong baseline?

Moreover, I save the dem as GEOtiff, but when I open it on ArcGIS, this is the image:

I know that the “elevation” image is the right while the “elevation_VV” image is wrong. Can save only the “elevation” image as GEOtiff without the “elevation_VV”?

Thank for your reply and I hope I am not hijacking the thread here!

elevation_VV is the one genetated by Sentinel-1, the other is the DEM used for Terrain Correction. The first, although the quality is not perfect, is your result.

Please have a look here, it clarifies the same misunderstanding: Using VV and VH to make DEM

1 Like

Hello All.
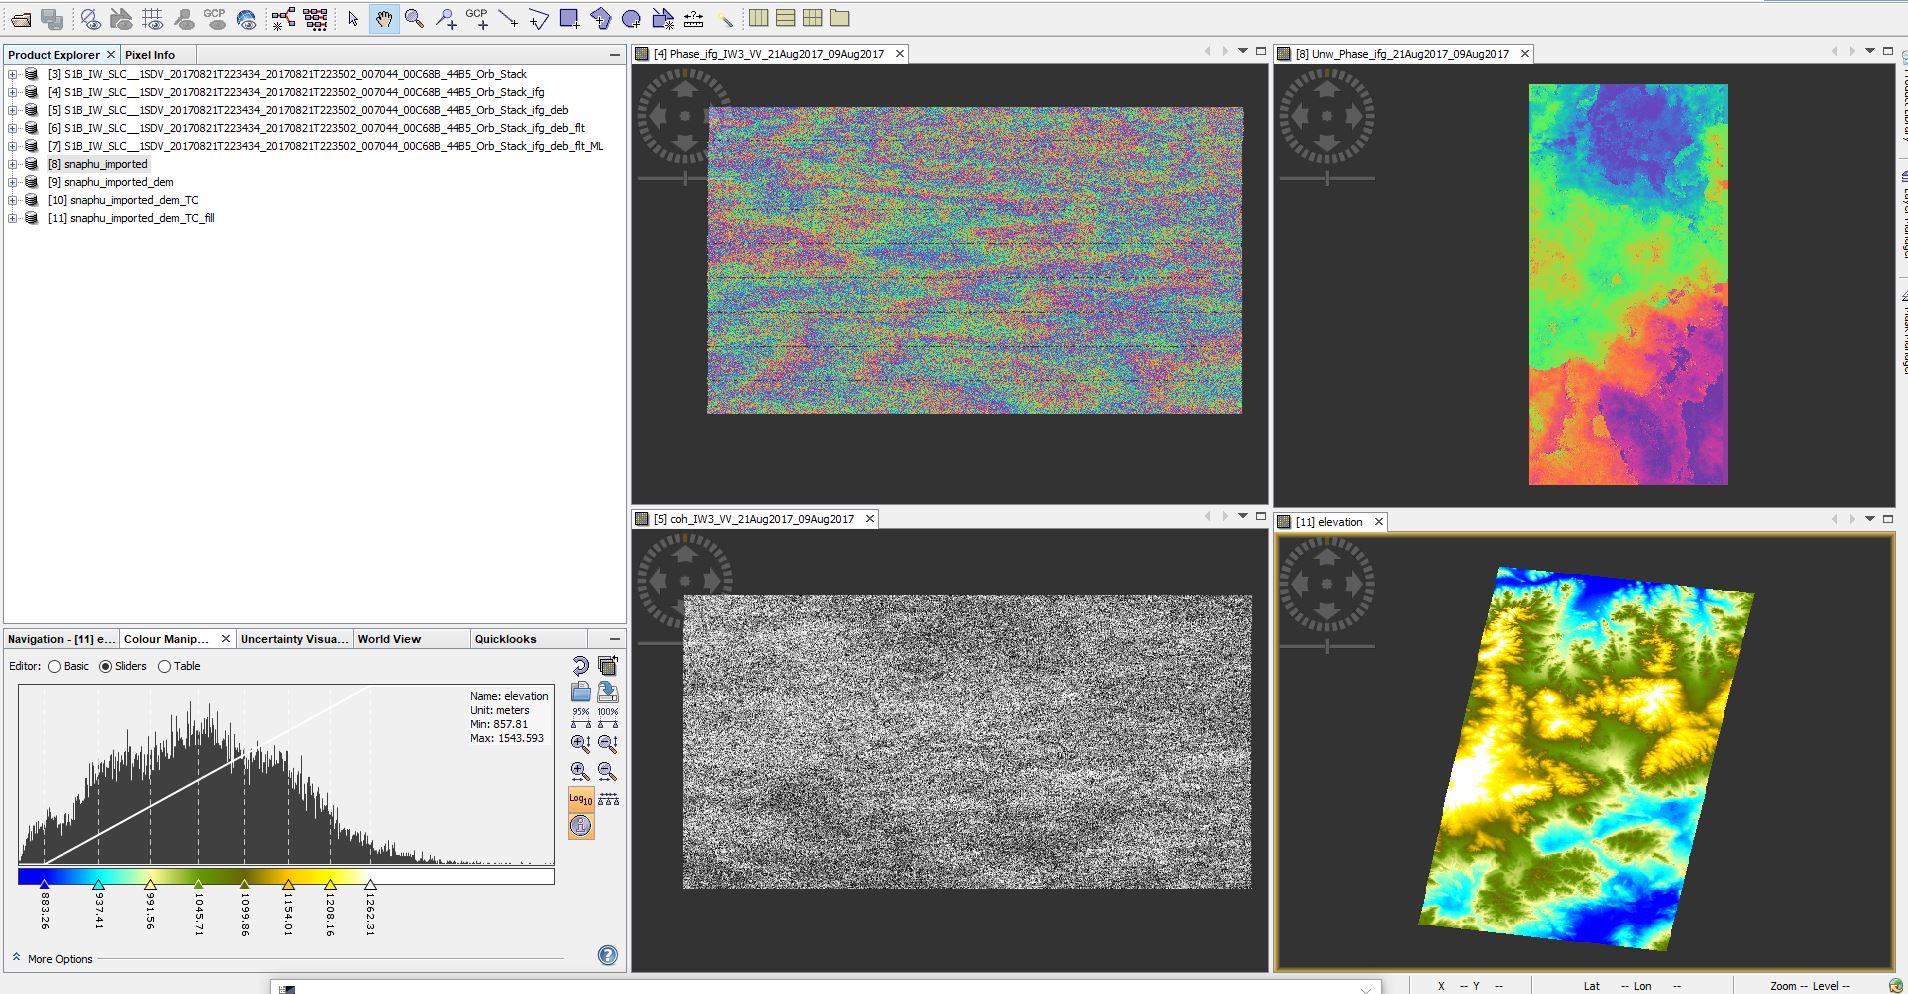
I created dem from sentinel-1B image. Here is my steps and result.

  1. S1 TOPS Coregistration
  2. Creating Interferogram
  3. Debursting
  4. Goldenstein Phase Filtering
  5. Multilooking
  6. Exporting to Snaphu, unwrapping and importing back
  7. Phase to Elevation
  8. Range-Doppler Terrain Correction
  9. Fill DEM hole

Finally, Q
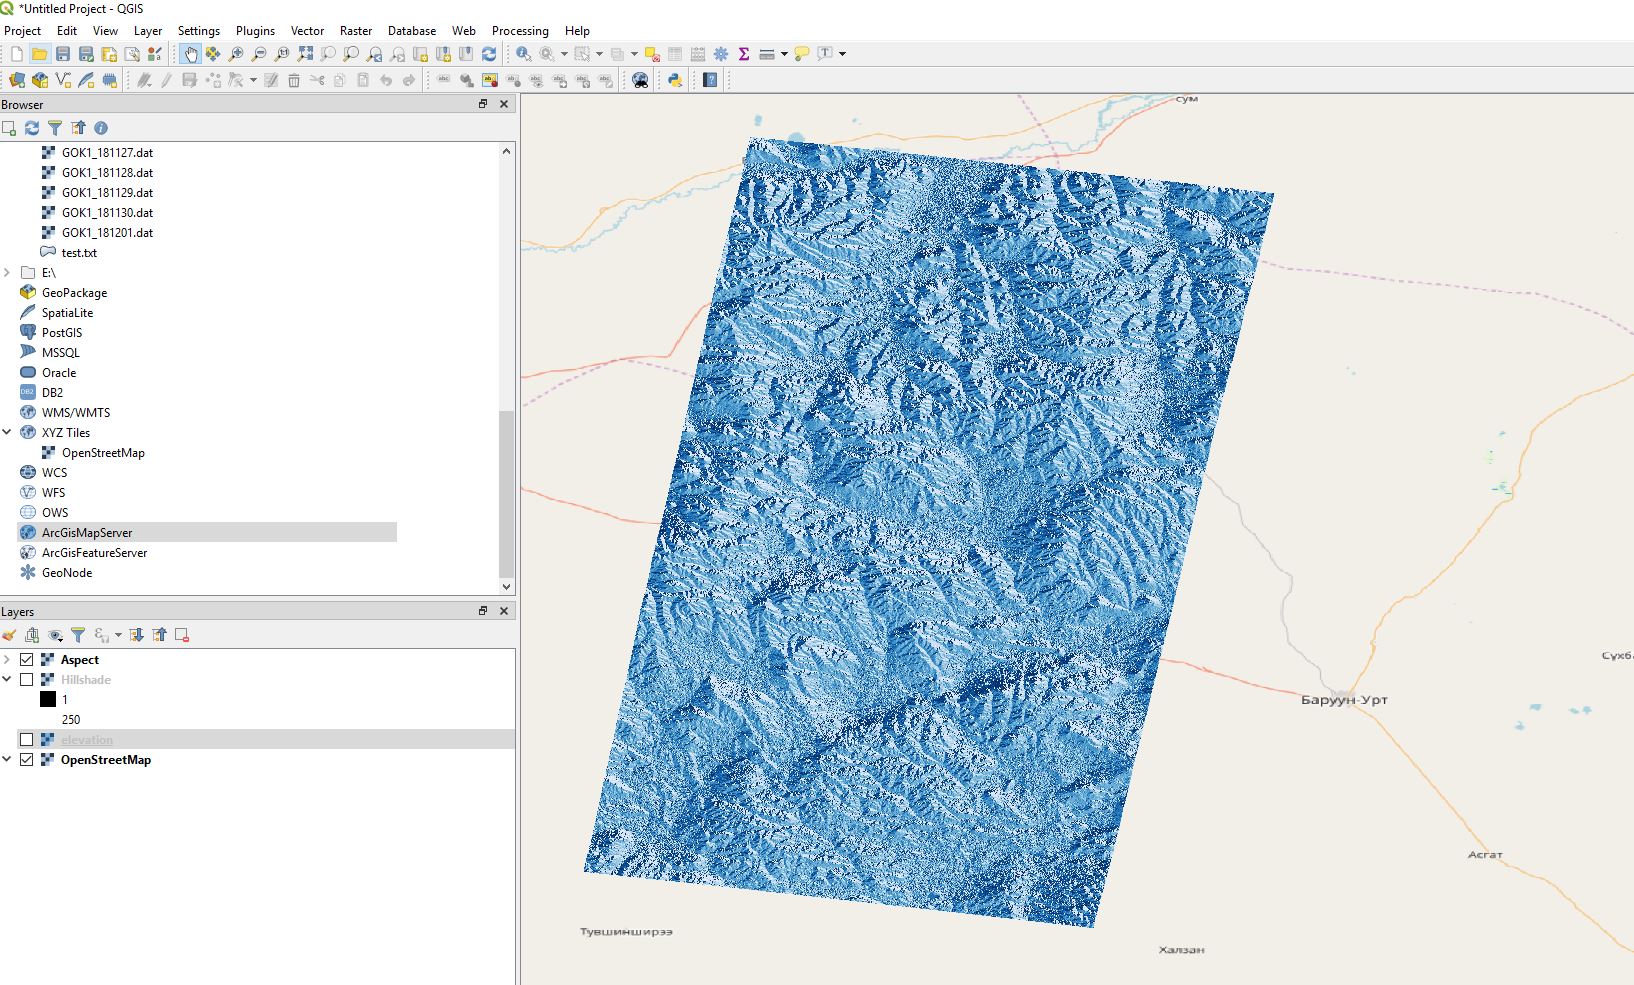
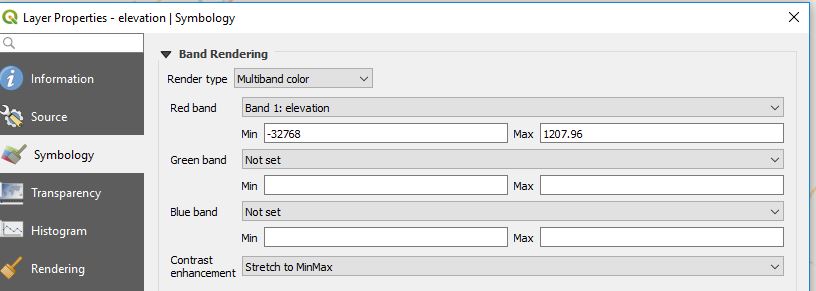
My final DEM imported into QGIS. But here is some problem of elevation limit (-32768).

  1. how i can remove minus value?
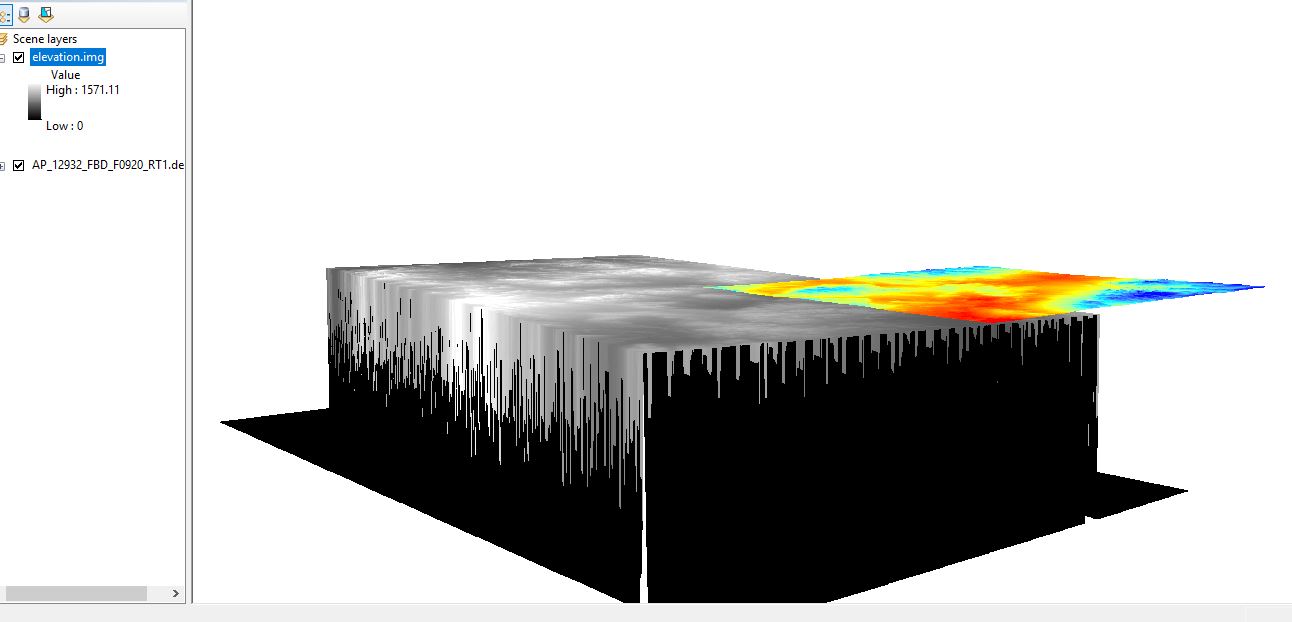
  2. Why it is showing me different height value on DEMs from ALOS and Sentinel? Which one is correct?


define -32768 as NoData value under “Transparency”. It will then by excluded from the color scale.

ALOS is L-band, Sentinel-1 is C-band. Both sensors have different interactions with the surfaces presenti in your study area. None of them is correct, nor false. But generally, L-band is more resistent to temporal decorrelation. As you see in your screenshots, coherence is not ideal in your image. The higher the coherence (and at best over large areas) the btter is the quality of the phase information to be expected. But there can still be atmospheric artifacts in the data.

The elevation you show in the screenshots (bottom right) is probably the one SNAP outputs from the Terrain Correction step. It is important to distinquish the one created as result of the InSAR DEM process and the one automatically downloaded as ancillary height information. Please have a look here: Using VV and VH to make DEM

1 Like

Hi again.
I pre-processed my DEM (mosaic, clip). After that, DEM height difference is changed. Now ALOS, Sentinel DEM are same as each other.
What happened on this? Especially, height range
diff


as I explained above, this is not your InSAR DEM. This ist just the SRTM which was used in the range doppler terrain correction step (same for both data).
Please read my comments here: Using VV and VH to make DEM

Kindly, Thank you ABraun.

According to ABraun, alaska guideline. I have generated this DEM.

Then i overlapped SRTM DEM. Here is question.
What is the some changes in picture?. What is the reason. is it height difference or some phase error?

There are many potential error sources.
Please have a look at these materials on the selection of suitable images and potential error sources:

Hi,

I have already created a DEM of my AOI (Nassiriya) with a couple of sentinel-1 images (perpendicular baseline = 30.43 m; temporal baseline = 12 d). Beside the low baseline, the coherence is very high

I applied the well-known steps, but the output DEM shows reversed and wrong height values, as I can verify on GIS, where I have also computed the hillshade. Here below my results:

My DEM after the Terrain Correction

The DEM on GIS: the highest heights should be in the north-west corner. The green circle is my AOI, an archaeological site.

This is a detail of my DEM: the green cirle should be on the top of a hill

How can I modify the height values (on GIS or SNAP)? Is there an option during the DEM generation to set in order to avoid these kind of errors?

Thank you for your kindly reply!!!

Maybe these are caused by atmospherical influences? You can try another image to see if the pattern remains.

There are no S1A and S1B IW SLC images in the same track of June to Aug. 2017, so that I used two S1B IW SLC images of 18, June and 6, June in 2017. The steps are as follows. Baseline is 83.45.

  1. S1 TOPS Coregistration
  2. Creating Interferogram
  3. Debursting
  4. Goldenstein Phase Filtering
  5. Exporting to Snaphu, unwrapping and importing back
    When export to Snaphu, I got UnwPhase_ifg_IW2_VV_18Jun2017_06Jun2017.snaphu.hdr, but in snaphu.conf is “snaphu -f snaphu.conf Phase_ifg_IW2_VH_18Jun2017_06Jun2017.snaphu.img 25800”, so that I changed all ‘VH’ to ‘VV’
  6. Phase to Elevation
  7. Range-Doppler Terrain Correction
    I get the elevation_VH rather than VV, and the DEM is not right. What is wrong with my step? And how can I revise?

Select VV polarization in the S1 TOPS Coregistration (tab Split) to avoid confusion with the data.

The DEM quality depends on high coherence and clear fringes. If these are not visible after the interferogram generation, you cannot do much. Have a look at this compilation on InSAR error sources: https://eo-college.org/resources/insar_errors/

Great !!! it’s a easy task,I know.

Hello, I want to ask if there are two bands in generation DEM (open in ARCGIS) exported by SNAP. Band_1 and band_2 have different DEM data.

hahaha,almost white coh band.I’ve ever seen,maybe comes from the temp baseline is 12. :gri


histogram

nning: