That’s the problem, I tried to make it like 100 times and every time I get an empty images, no errors appeared. I did all the steps above
If you tell us what steps you undertook and which data you used, we maybe can help you. Screenshots are always good.
I am not looking for easy solutions ! it’s my first time using snap and as u can see i am really willing to understand it ! that’s why i am posting questions all the time. May be it looks dumb to u but i am trying my best. Thanks for responding to my post but i felt offended by your words. May be u did understand me wrong. I’am only seeking for some pieces of advice and help that’s all. And i am sorry if my post bothered you
Dear @khaldi ,
My post was answering a question asked by hardbasova but it got deleted in the meanwhile. So no need to be offended - i don’t think there are stupid questions in here. Sorry for the misunderstanding.
Addressing your question: Do you want to export the values of the histogram or the image itself?
1 Like
i am sorry too. i did misunderstand it.
Is the GCPs(Ground control points) really necessary for creating a InSar DEM? I do not think so.
Have you noticed the values around the boundary areas of @janaya 's created DEM? They are quite different with the values in the core regions of the image.
There was a dividing line along the red arrow. What’s the reasons? And how to solve this problem? @ABraun

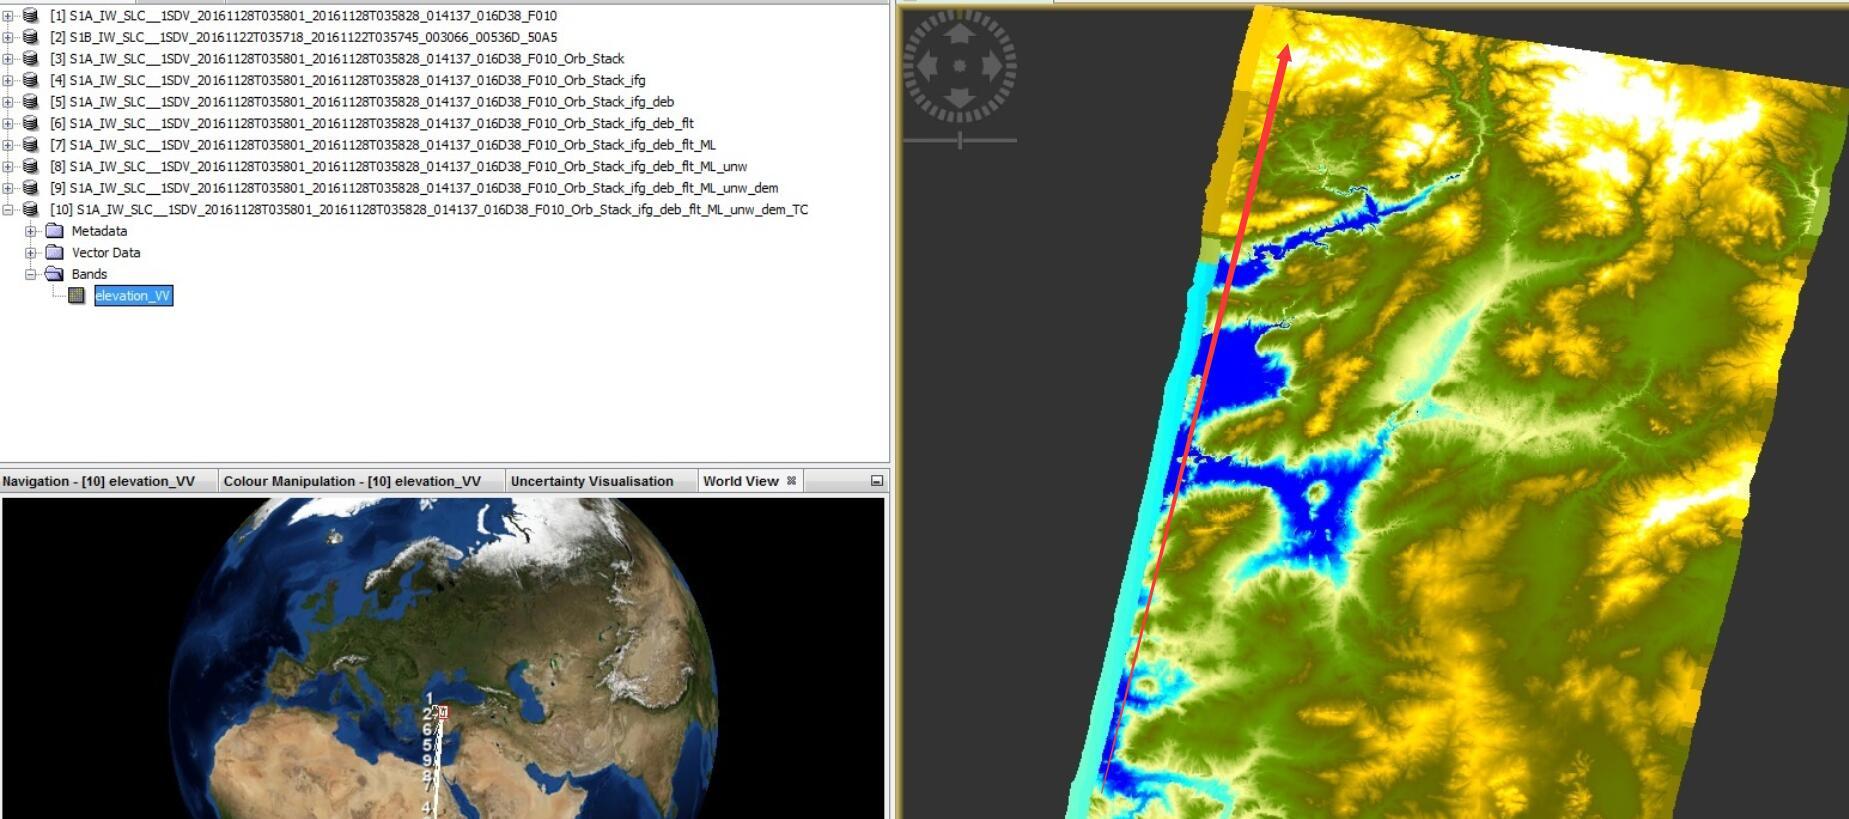
Have you noticed the values around the boundary areas of your created DEM? They are quite different with the values in the core regions of the image.
There were two dividing lines in the left and right part of your image, respectively.
What’s the reasons? And how to solve this problem? @ABraun
the strange values at the edge of images result from different coverages of both images.
Please have a look at this post and especially falahfakri’s answer
I need some advise:
I have the perfect setting for Sentinel-1 InSAR, desert-like conditions, no vegetation cover, very high coherence (> high temporal coverage (my baseline is 12 days) but keep getting miserable results. My steps:
- S1 TOPS Coregistration with ESD
- Interferogram generation
- Goldstein Phase Filtering
- Phase unwrapping with snaphu
- Phase to elevation
It seems that already the interferogram is below what it could be. The topography is clearly more distinctive, even in a 30m SRTM. But I cannot get close to that with Sentinel-1 data.
I tried different image pairs to reduce the chance of atmospheric distortions, but the results are the same. Any ideas what else can cause this low quality?

I think you are hitting the limits of the technique, as indeed the coherence is as good as one could ever expect it to be. Perhaps the baseline is quite short? Longer baseline increases sensitivity to elevation, while the atmospheric/ionospheric noise-level stays the same.
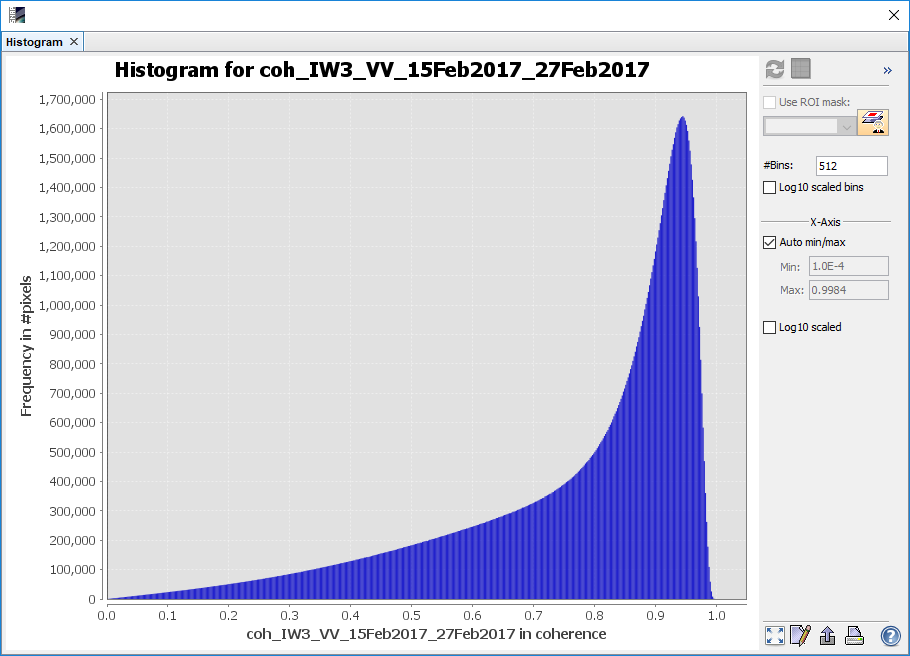
ps. great looking coherence-image, are the river-systems current ones or perhaps paleo-ones (covered by sand)?
1 Like
thank you for the comments. I’ll try the baseline tool of ASF to have a better image pair with higher baseline.
The low coherence areas are wadis which hold coarser sands and are hold water (or at least are saturated) for short times.
the images above had a perpendicular baseline from 13 m, not enough - you are right.
The test below was made with an image pair of 12 days and 138 m, but results are still not very good. I wonder why it worked so well in the Turkey example from above and there are hardly usable results in Mali where conditions are even better.

You can only keep looking at interferograms and hoping to find a pair with the least amount of ionospheric/tropospheric disturbance. What is your use-case BTW? Isn’t SRTM good enough in that area?
1 Like
Actually I’m just curious about the quality which can be achieved. We use the dem for runoff modeling and groundwater exploration. If some fractures could be enhanced I would be happy.
But I’ll keep testing.
Hello, musicnerd! You did it good, could you tell me the specific steps ? Thank you very much!
Hi everyone! I have a pair o images with Bper=103,29m and model. Coherence=0,89. I have processed the pair and when it comes to the Histogram of Phase I get this:
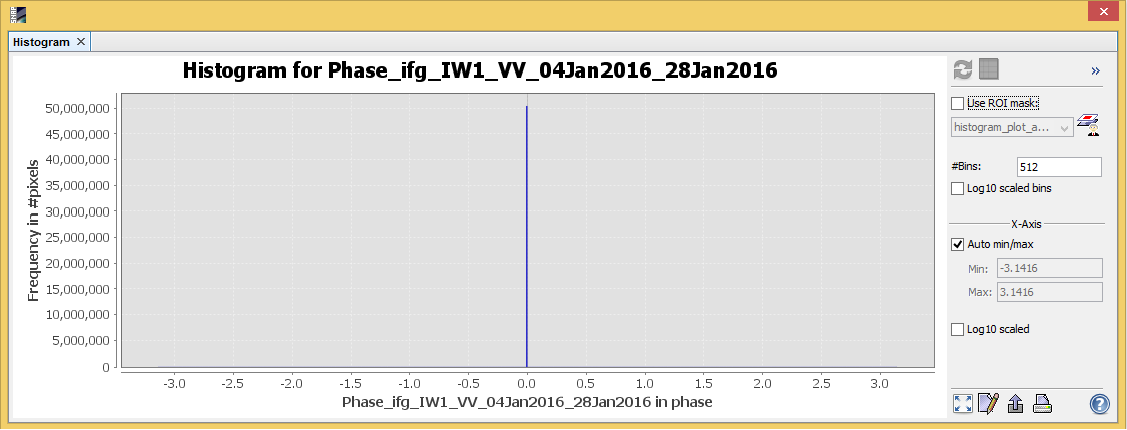
I am pretty confused and I literally don’t know what to do. Can anyone help me or give me a tip?
Thanks in advance,
Christina
please see here: Proccessing SAR images
Hi,
where can I find the tutorial that you have linked? Is it on Amazon AWS?
Thank you very much!
it is now located here: http://step.esa.int/docs/tutorials/S1TBX%20TOPSAR%20Interferometry%20with%20Sentinel-1%20Tutorial.pdf
2 Likes