Hello.
My colleague made an analysis, which seems to show that thermal noise removal works differently when input is slice assembled product, vs a single product.
Following is a description and necessary information to reproduce the issue.
Two graphs are needed:
-
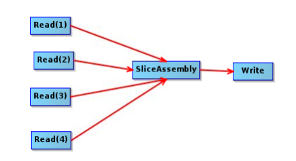
Simple slice assembly SNAP graph, for example:

-
Graph to obtain intensity from SLC input:

Now there are two tests, first (I) is with slice assembly: -
Using 1st graph and specified input products create a slice assembly;
-
Using obtained slice assembly run the second graph specifying extra parameters, such as: set a tick to export thermal noise pattern in “ThermalNoiseRemoval” node, export all available bands – Intensity_VH,Intensity_VV,NEP_VH,NEP_VV, use default parameters for resolution 13.87in meters and 1.2459632990737763E-4 for degrees, together with SRTM 3Sec as a DEM, BILINEAR_INTERPOLATION, and using the following region to subset the raster - ‘POLYGON ((25.231528 59.526399, 27.172581 59.538235, 27.167708 58.552172, 25.281438 58.540786, 25.231528 59.526399))’ with predefined projection as epsg code 32635. As a result of these two runs there should be no errors.
Second (II) test is using the same approach but with single SLC .SAFE product as an input:
- Using S1A_IW_SLC__1SDV_20230801T043443_20230801T043510_049677_05F93D_C47E.SAFE run the second graph specifying exactly the same processing parameters as in the first case. As a result of this run there should be no errors.
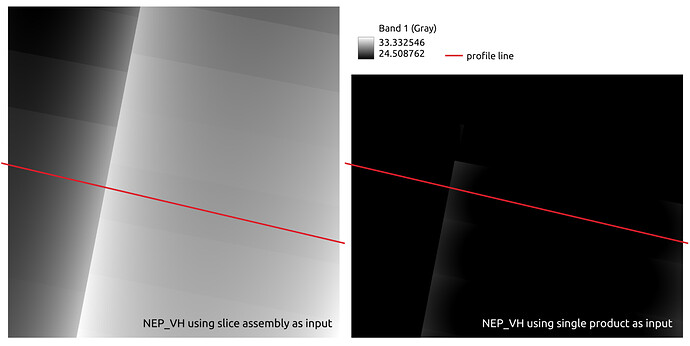
Let’t look at the data. There now should be two BEAM-DIMAP files. First we go to the .data directory of the output which was generated using slice assembly raster as an input, and open NEP_VH.img in qgis, and we do the same with output generated from a single product. As I understand, NEP raster contains thermal noise profile which is used in thermal noise removal node.
We now set them to identical styles (see the image) and we can see that raster look very much different:
Here is a profile along the line (notice how much different values are):

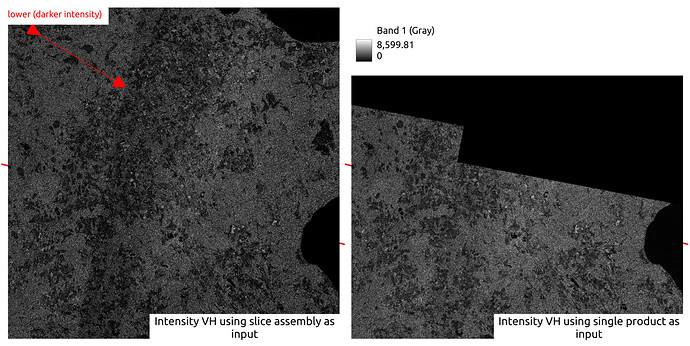
We can also try to take a look at Intensity images: from the same .data directories open corresponding Intensity VH.img files, set identical color schema, and observe that intensity along
swath boundary is weaker (darker) in the raster obtained from slice assembly as an input, with a very prominent and sharp border between swaths:
Is this an expected behavior or not? To me it seems that it is not, and my assumption is that Thermal Noise Removal is too strong in case of slice assembled products, which is causing dark stripes.

