Time-series Analysis after new data added

I am conducting ground subsidence-related time-series analysis using ISCE2 and MintPy.

I used a total of 30 SAR images, created a stack using ISCE2 (4.3 Example workflow: Stack of interferograms), and generated the final time-series results using MintPy. It took quite a long time to complete.

After obtaining the results, when new data (a total of 31 images) is added, do I need to repeat the same process? In other words, even though the time-series analysis is already complete, do I have to repeat the entire process each time new data is added over time? Or is there a way to process only the new data?

If I have to repeat the process each time new data is added, using the most recent data for the time-series analysis and then having to redo the process as new data with new dates is added seems like it would consume a significant amount of resources. I would appreciate your advice on this matter.

By the way, how to run all run files at once in ISCE2? (run_01, run_02, run_03, …, run_14)

It seems that your question is about the usage of ISCE2 and MintPy, so you might be better off asking in the ISCE2 discussion section on GitHub (see below). I assume you are using one of the ISCE2 stack workflows (stripmapStack or topsStack). The setup programs for those workflows are designed to efficiently add new data to the stack processing as they will look at the existing stack and determine what new steps are necessary to add a new scene to the stack. It only works if you are adding a new scene at the end of the stack, not in the middle or beginning, but that seems to be what you want to do. The only trick is you need to rename your run_files directory to another name like run_files_to_March2023 before rerunning the stack setup program.
It is possible to write a small script in your favorite scripting language, Python, bash, csh, etc. to run all of the run files in order. The stack workflows include a run.py program that makes it easier to run all the run files in a step and includes a parallel run option if you are using a computer with a lot of resources. The parallel option has to be used carefully or you can overload your system. This is my csh script for running topsStack:

#!/bin/csh
# updated for ISCE2 2.4+ trunk

run.py -i run_01_unpack_topo_reference -p 2 >& run_01_unpack_topo_reference.log
run.py -i run_02_unpack_secondary_slc -p 2 >& run_02_unpack_secondary_slc.log
run.py -i run_03_average_baseline -p 2 >& run_03_average_baseline.log
run.py -i run_04_fullBurst_geo2rdr -p 2 >& run_04_fullBurst_geo2rdr.log
run.py -i run_05_fullBurst_resample -p 2 >& run_05_fullBurst_resample.log
run.py -i run_06_extract_stack_valid_region -p 1 >& run_06_extract_stack_valid_region.log
run.py -i run_07_merge_reference_secondary_slc -p 2 >& run_07_merge_reference_secondary_slc.log
run.py -i run_08_generate_burst_igram -p 2 >& run_08_generate_burst_igram.log
run.py -i run_09_merge_burst_igram -p 2 >& run_09_merge_burst_igram.log
run.py -i run_10_filter_coherence -p 2 >& run_10_filter_coherence.log
run.py -i run_11_unwrap -p 8 >& run_11_unwrap.log
1 Like

Thank you for reply, @EJFielding

As you mentioned, I am using ISCE2 and MintPy as you instructed, and for ISCE2, I used topsStack. When I followed the method you provided, I obtained the desired results. Thank you.

I apologize for asking more questions while you provided an answer, but I have a few more things to inquire about. I used stackSentinel.py in ISCE2 to create an interferogram stack and used MintPy to generate time-series results. The code ran without any issues, but there is something strange about the results.

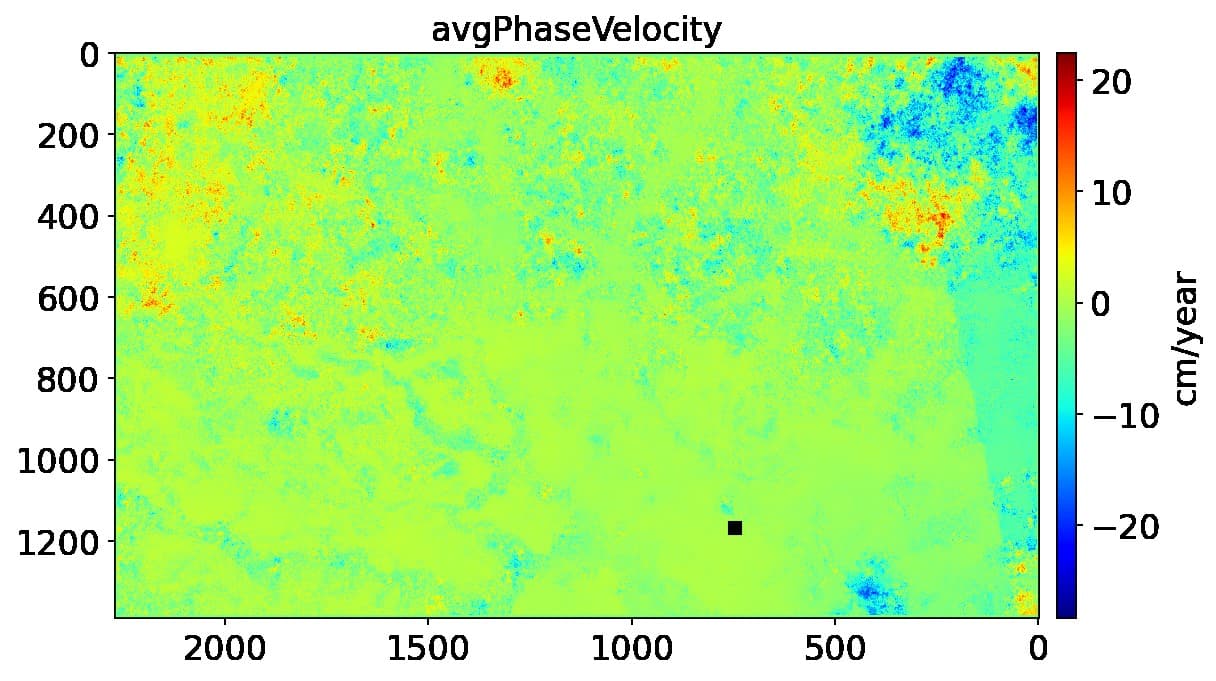
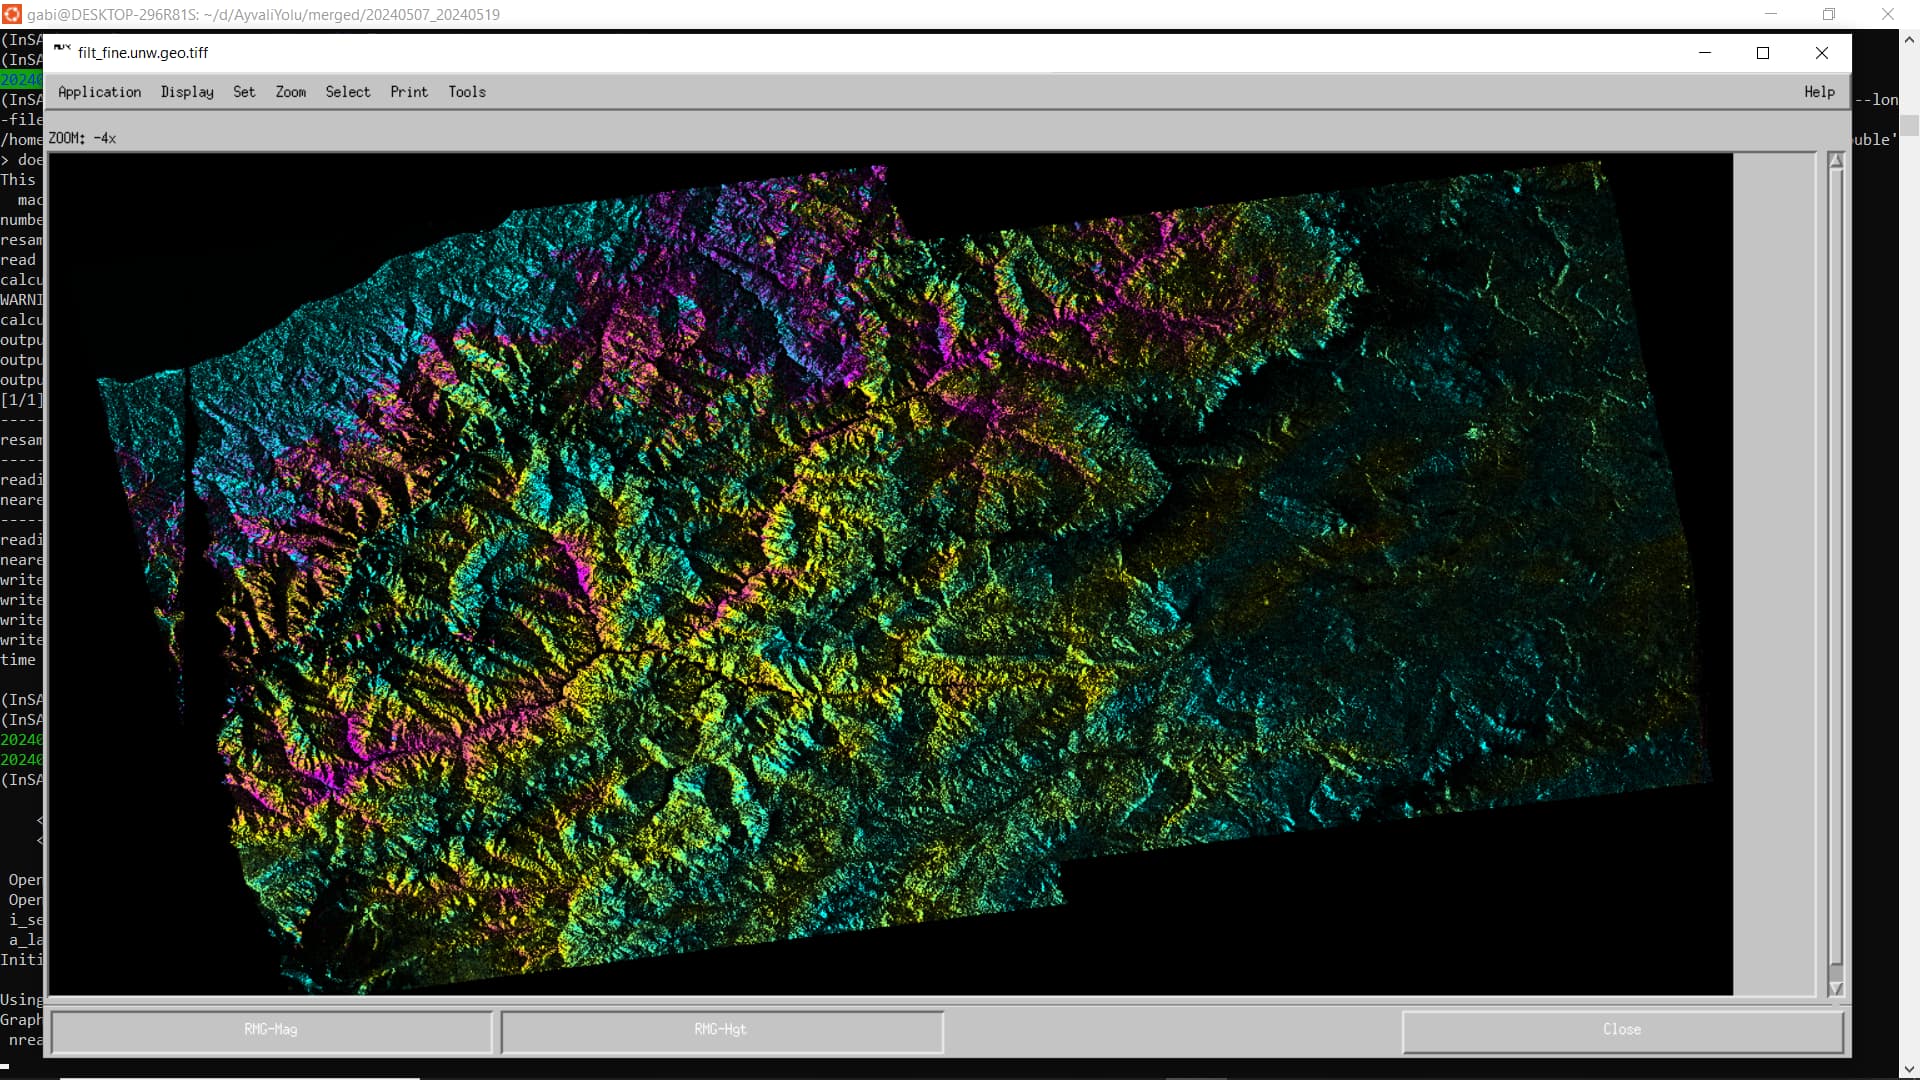
In most of the PNG data from MintPy’s results, the region I set as the bbox (bounding box) appears empty. I want to analyze only the area within the bbox, but the actual results apply to a larger extent than the bbox, and furthermore, the bbox area appears only in black. It seems that only the bbox portion of the results is missing.

Why do you think this phenomenon is occurring?
(In the image attached below, the black area precisely corresponds to the region I set as the bbox.)

  1. Reason for the larger area in the result compared to the bbox I set

  2. Reason the only bbox I set appears in black

  3. And how can I analyze only the desired area(bbox)?
    (What options should I manipulate in ISCE2 and MintPy?)

Referecnes
Below is the command I used to create the stack using ISCE2:

stackSentinel.py -s SLC/ -d DEM/demLat_N10_N12_Lon_E105_E107.dem.wgs84 -b ‘11.0295 11.1651 106.5815 106.7192’ -a AuxDir/ -o Orbits -c 2

Here is the “avgPhaseVelocity.png” from the results of MintPy:

Below is the text file that I provided as input when running “smallbaselineApp.py” in MintPy:

##-------------------------------- MintPy -----------------------------##
########## 1. Load Data (–load to exit after this step)
###load_data.py -H to check more details and example inputs.
mintpy.load.processor = isce
##---------for ISCE only:
mintpy.load.metaFile = …/reference/IW*.xml
mintpy.load.baselineDir = …/baselines
##---------interferogram datasets:
mintpy.load.unwFile = …/merged/interferograms//filt_.unw
mintpy.load.corFile = …/merged/interferograms//filt_.cor
mintpy.load.connCompFile = …/merged/interferograms//filt_.unw.conncomp
##---------geometry datasets:
mintpy.load.demFile = …/merged/geom_reference/hgt.rdr
mintpy.load.lookupYFile = …/merged/geom_reference/lat.rdr
mintpy.load.lookupXFile = …/merged/geom_reference/lon.rdr
mintpy.load.incAngleFile = …/merged/geom_reference/los.rdr
mintpy.load.azAngleFile = …/merged/geom_reference/los.rdr
mintpy.load.shadowMaskFile = …/merged/geom_reference/shadowMask.rdr
mintpy.load.waterMaskFile = None

mintpy.reference.lalo = None
mintpy.topographicResidual.stepFuncDate = None #eruption dates
mintpy.deramp = linear

s a point of reference, I haven’t modified any configurations other than the command used to create the stack in ISCE2 and the txt file used for running smallbaselineApp.py in MintPy.

Thanks

I am not sure what is going on with your time-series analysis, but I am guessing that you have very low coherence. If the temporal coherence is very low, then the whole area may be below the temporal coherence threshold. MintPy uses temporal coherence to mask the results, so it might be all masked out.

For MintPy questions, it is better to ask on the very active MintPy Google Group:
https://groups.google.com/g/mintpy

1 Like

I looked again at your area box. The ISCE2 software works much better if you use at least two Sentinel-1 bursts, so you should specify a processing area that is at least 30 km in the latitude direction. You can analyze a smaller area in MintPy later.

1 Like

@EJFielding Hi, perhaps I’m not understanding it correctly because it seems surprisingly complicated. Wouldn’t it be much simpler to process any new scenes with the same reference image and then stack the old and new results together? For distributed stack processing, we obviously don’t need all the scenes on every node.

@MBG Yes, that is what the ISCE2 topsStack workflow does, process new dates to the same reference as an existing stack to extend the stack.

1 Like

Thank you for your response, @EJFielding
I will ask more detailed questions about the places you mentioned.

What are the characteristics that should has my PC to process with ISCE2?!

I don’t know if it is possible to install and run ISCE2 on Microsoft Windows. It can be installed on PC’s running some variety of Linux. You will need a good amount of disk space (probably 2 TB minimum) and at least 16 GB of RAM to do any significant processing with ISCE2.

2 Likes

Hi Mr Fielding…

I have installed several dependencies to ISCE 2, but I have a doubt, to the RelaxIV file, I have that install only that file?

because when I access to the GITHUB of frangio68 I can see several folders

Please Mr Fielding help me with this

The “unwrap 2 stage” installation of Relax and Pulp is optional. I have not tried to install them on my computer/

1 Like

Hi Professor Fielding

I ran again the script of installation and I have the following message, although I obtained the pythonpath :woozy_face:

A post was split to a new topic: NISAR data support

The following figure was my unwrapping ifg obtained with ISCE 2 using SENTINEL 1.