Time Series Analysis Tool - Possible Bug

Hi
we are working with a temporal set of S1 GRD images and have entered the images in a stack as well as separately into the time-series tool. entered individually, we do get a time-line, however, the range is fixed from 0 to 100 so the intensity line is at zero. we have updated all plugins following the success of abhiyaam post on the Feb '19, but still no success. is there a specific plugin needed or any ideas on what might be wrong. we are using SNAP 7.0.3. thanks

press shift to update the y-axis to a reasonable range for the currently selected pixel

thanks, we are unsure of what to press for the y-axis update. we can toggle the x axis range using the cursor position icon on the time series tool but not the y-axis. can you tell us what we are missing?

there is another problem that might be related. when we try to draw an ROI on the image using SNAP draw tool, SNAP freezes and we have to close SNAP with the task manager and restart. reading previous posts, we noticed this occurred in SNAP 6.0. we have SNAP 7.0 installed. is this a continuing problem in SNAP?

sorry, the formatting somehow removed the most important word :sweat_smile:
I updated the post: When you press the [shift] key, the y-axis will be adjusted.

I noticed a similar thing. If you have many rasters and large ROIs, SNAP takes quite a long time and sometimes crashes.

Try to close the time-series tool before digitizing the polygon, then save the product and open the time-series tool again.

great! got it…thanks

a new tutorial on time-series analysis has been published: Time-series analysis with Sentinel-1

2 Likes

I tried to get temporal analysis of Sentinel data (time serie), the time serie tool is always blank. I upload the stack product, i tried to upload the separate products, I create pins, I even create polygone around my AOI but the same problem persists. Do you some hint about how to solve this problem?

the time series analysis tools takes a list of single images with the same band as input, not a stack.

Sorry but i am still confused. above in this discussion, you mentionned that you select a stack as input and latlely you said that the time serie analysis tools does not take a stack


On my analysis, I try to plot the temporal profil of a land subsidence. I created a stack in which I calculate the cumulative displacement over the study period masking the area of low coherence. please how can I get the temporal profil using the time serie snap tool.
Here is my stack image. when I click on filter, there is no effect

sorry, this description is from 2018 and no longer applies. SNAP is constantly being developed and adjusted. So if you take all geocoded displacement bands the the plots should work. It is also described like this in the tutorial I mentioned above which is from 2020.

Just out of interest: What happens when you input the stack, select the filter icon and there select displacement as band?

I am going to explain my process for the stack product and for the separate geocoded product:
1 for the stack


when I click on the image, nothing appear on the time serie display part

i also insert pin but still no temporal profil

2 with the geocoded products


again there is no effect.

can you please show what is offered when you click on the filter icon?

I just tested with 5 S1 image pairs.

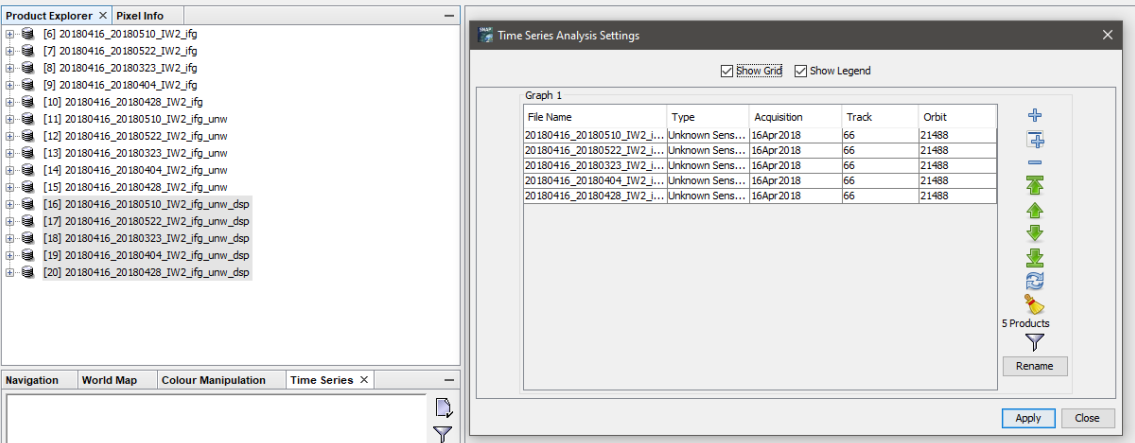
Strangely, the acquisition date of the master image is used for all displacement pairs, which of course prevents a correct time series plot. This is not the case for you, as I see in the screenshots

can you please show what is offered when you click on the filter icon?
when I click on the filter button, there is no effect on the display part.

You are right in my case I use 4 pair of image in which the slave of 1 pair is the master of the next pair in chronological order. Do you think this may be the reason of my problem?

I experienced the same, clicking on the filter does not show a new window when interferograms were loaded into the tool

thank you for your reply. My period of study cover 4 years. So if i keep the the same initial image as master image for all the other images, I afraid about the decorrelation between the first (2016) and the other images with a temporal baseline more than 1 year causing inaccuracy of my result. Do you have any suggestion please?

I have no solution which works inside SNAP, sorry. Splitting a long period into small temporal baselines absolutely makes sense.

The only thing you can do at the moment is create a stack of terrain corrected displacements, set a pin and extract the pins’s displacement values to a table which you visualize in MS Excel, for example.

i got it. thank you for your kind support

Hello everyone! I want to change some things in Time Series and I don t know how. Like colors of the graph s lines, title that is show on the left side of the graph. Please help!!