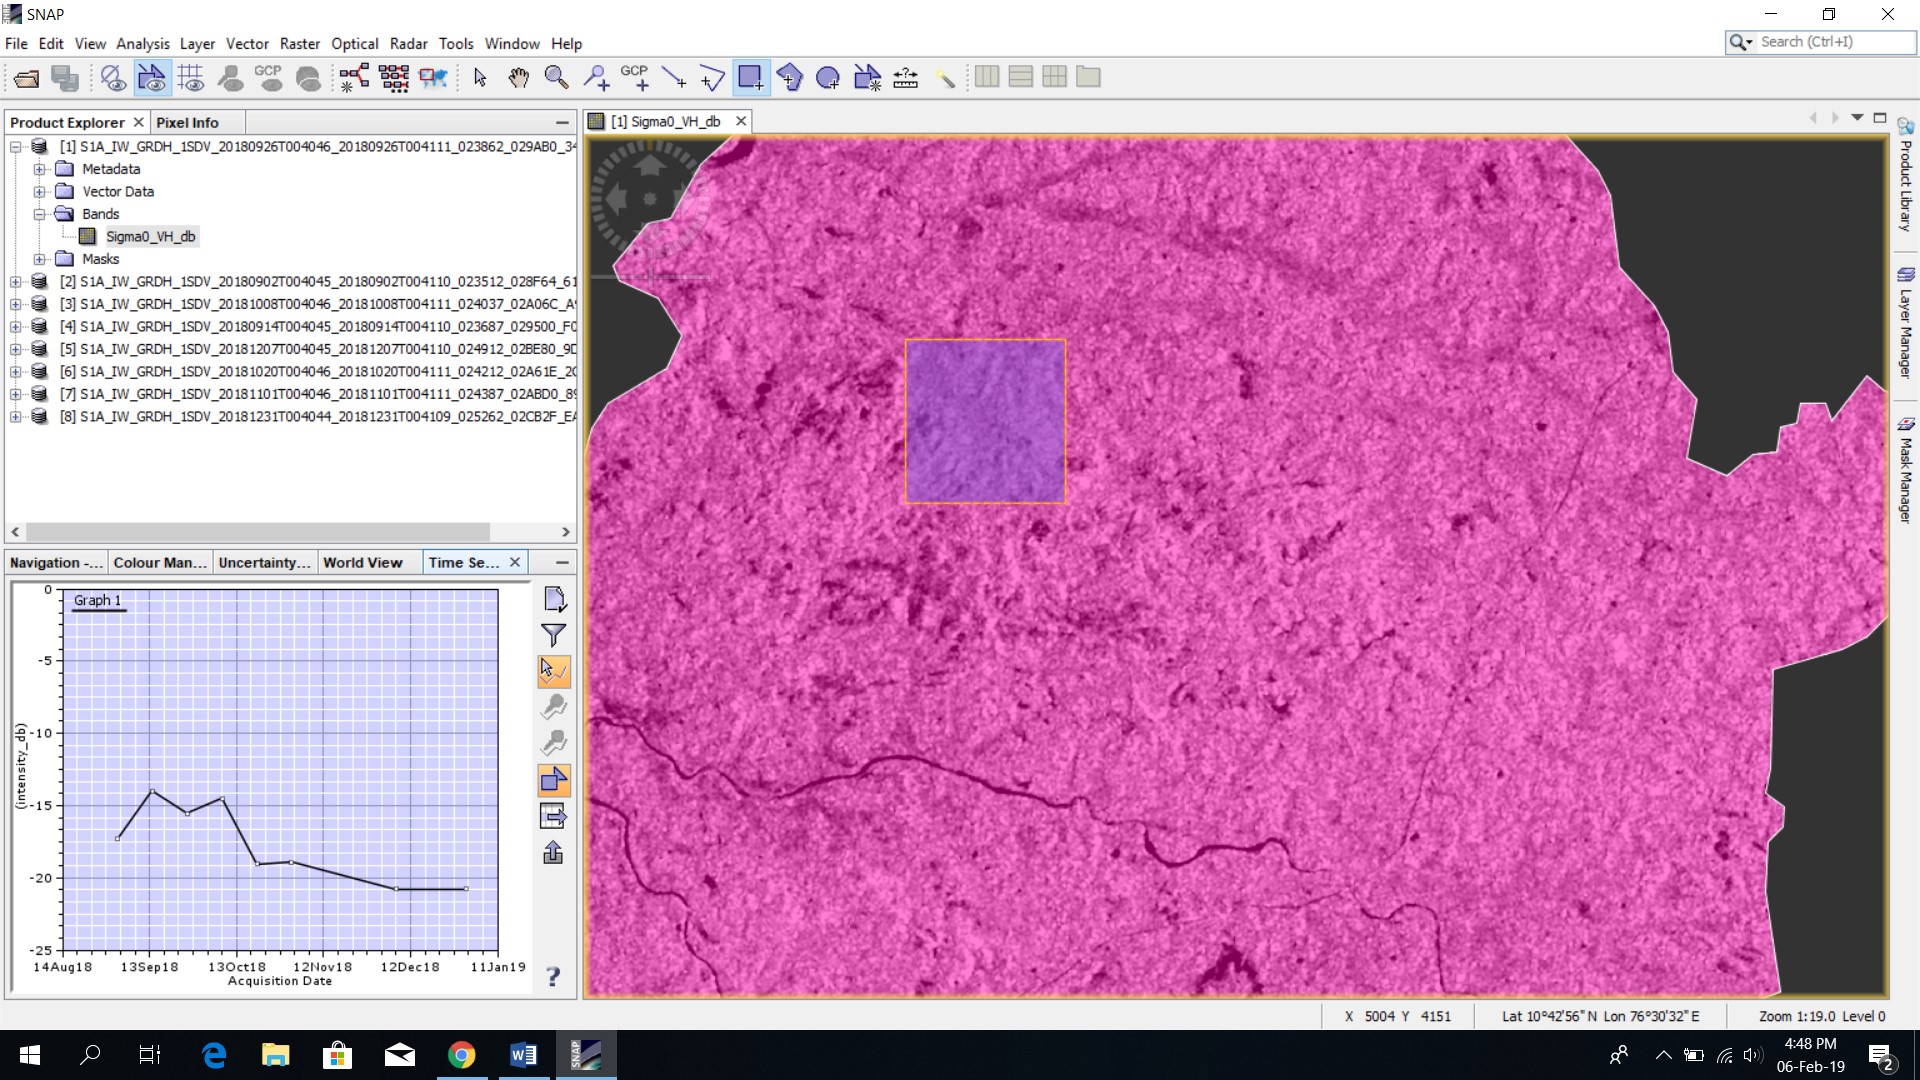
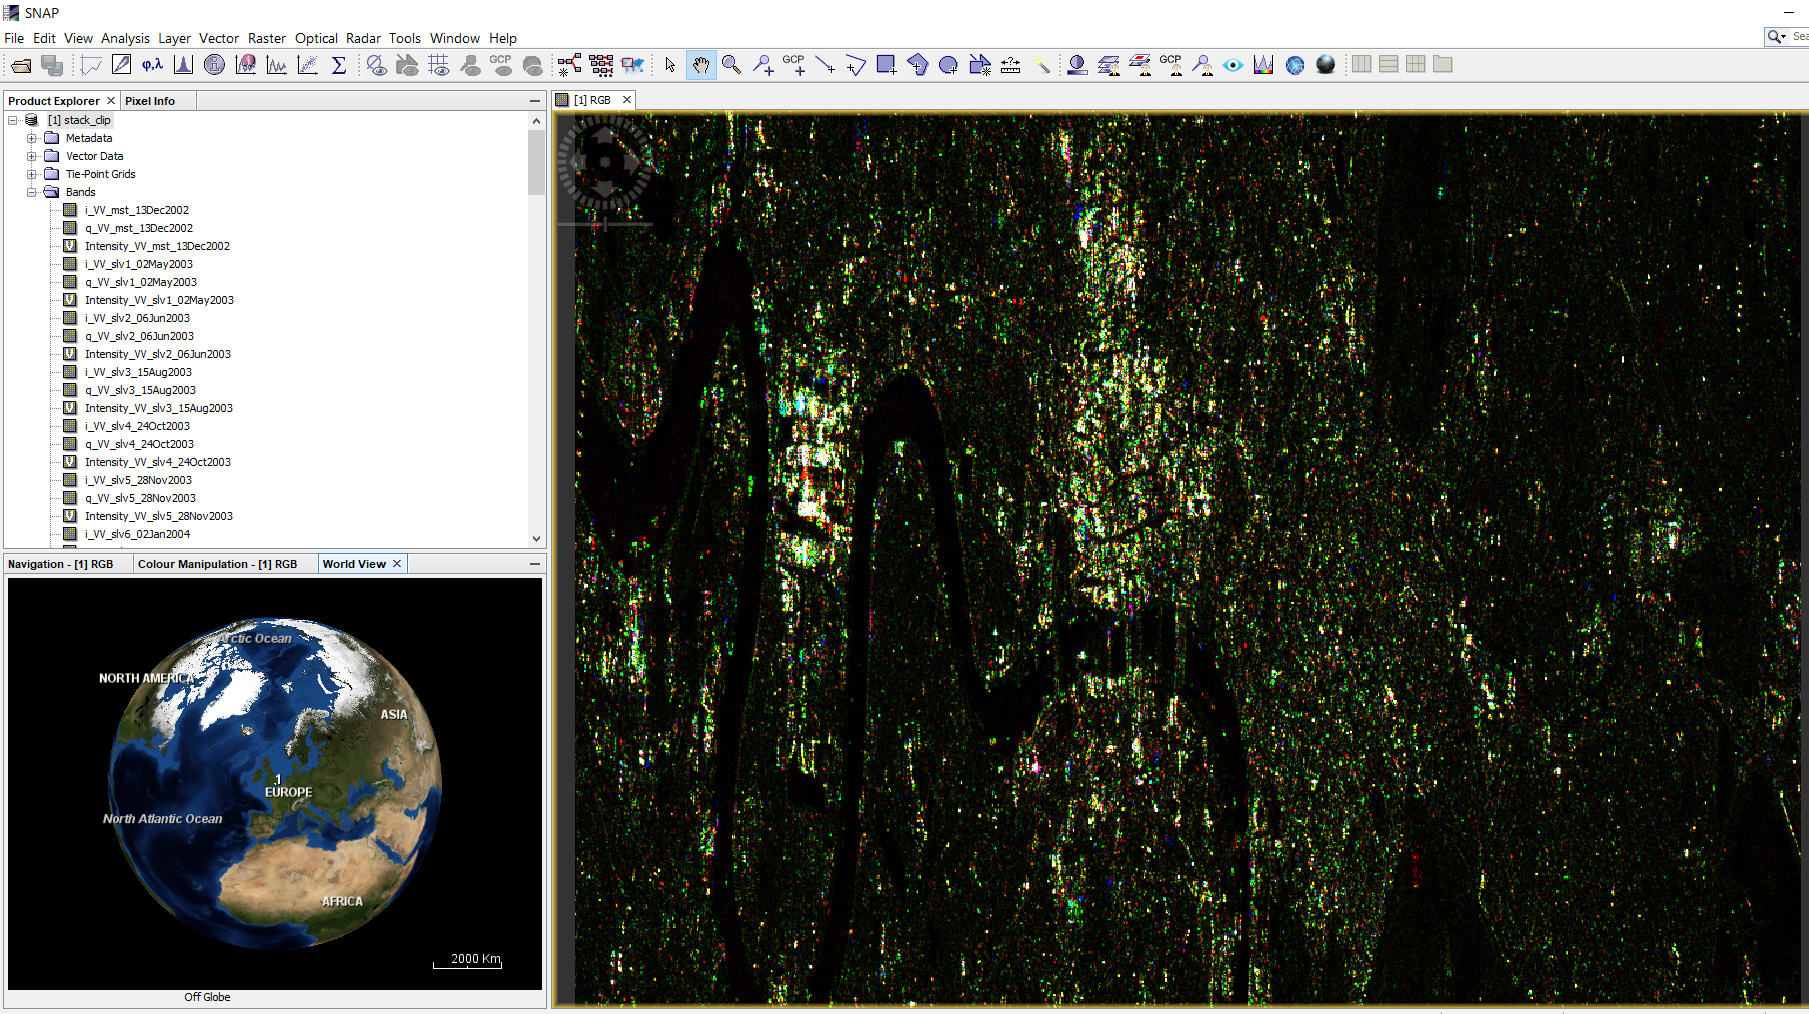
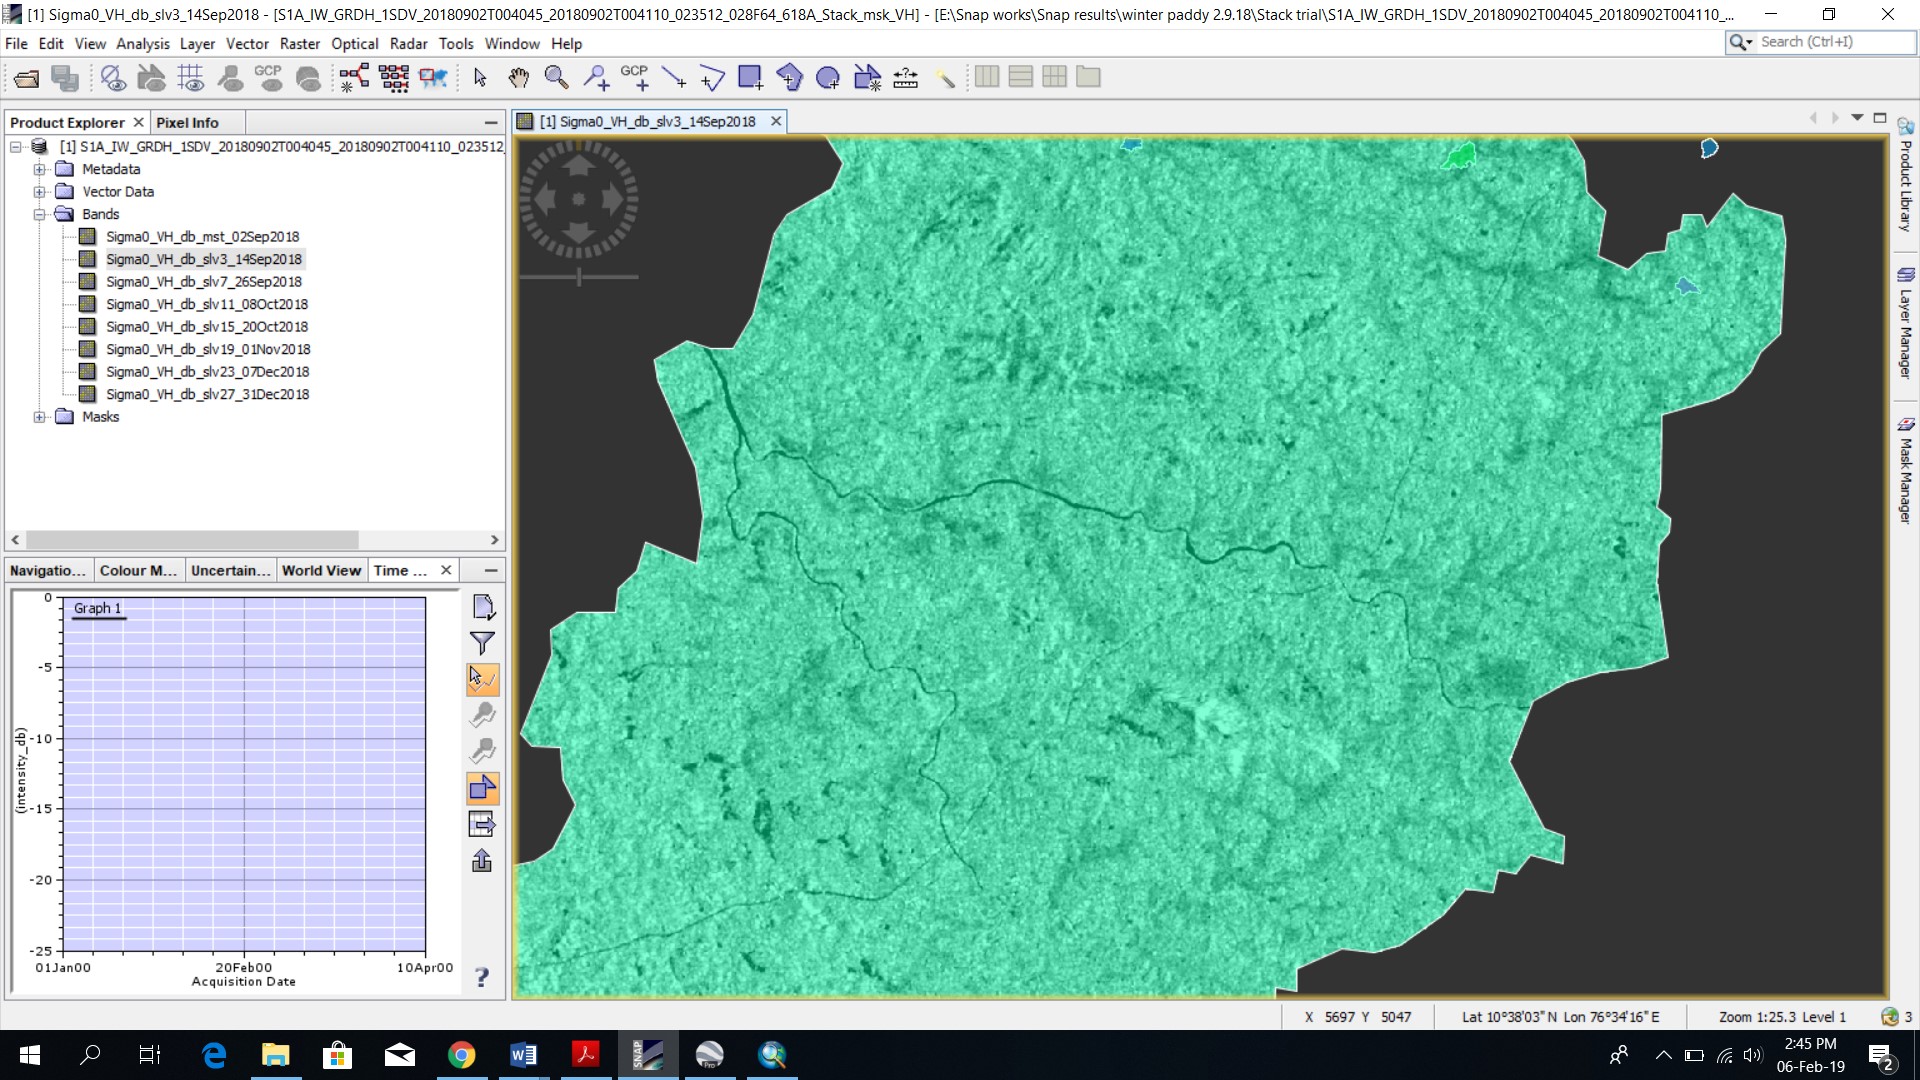
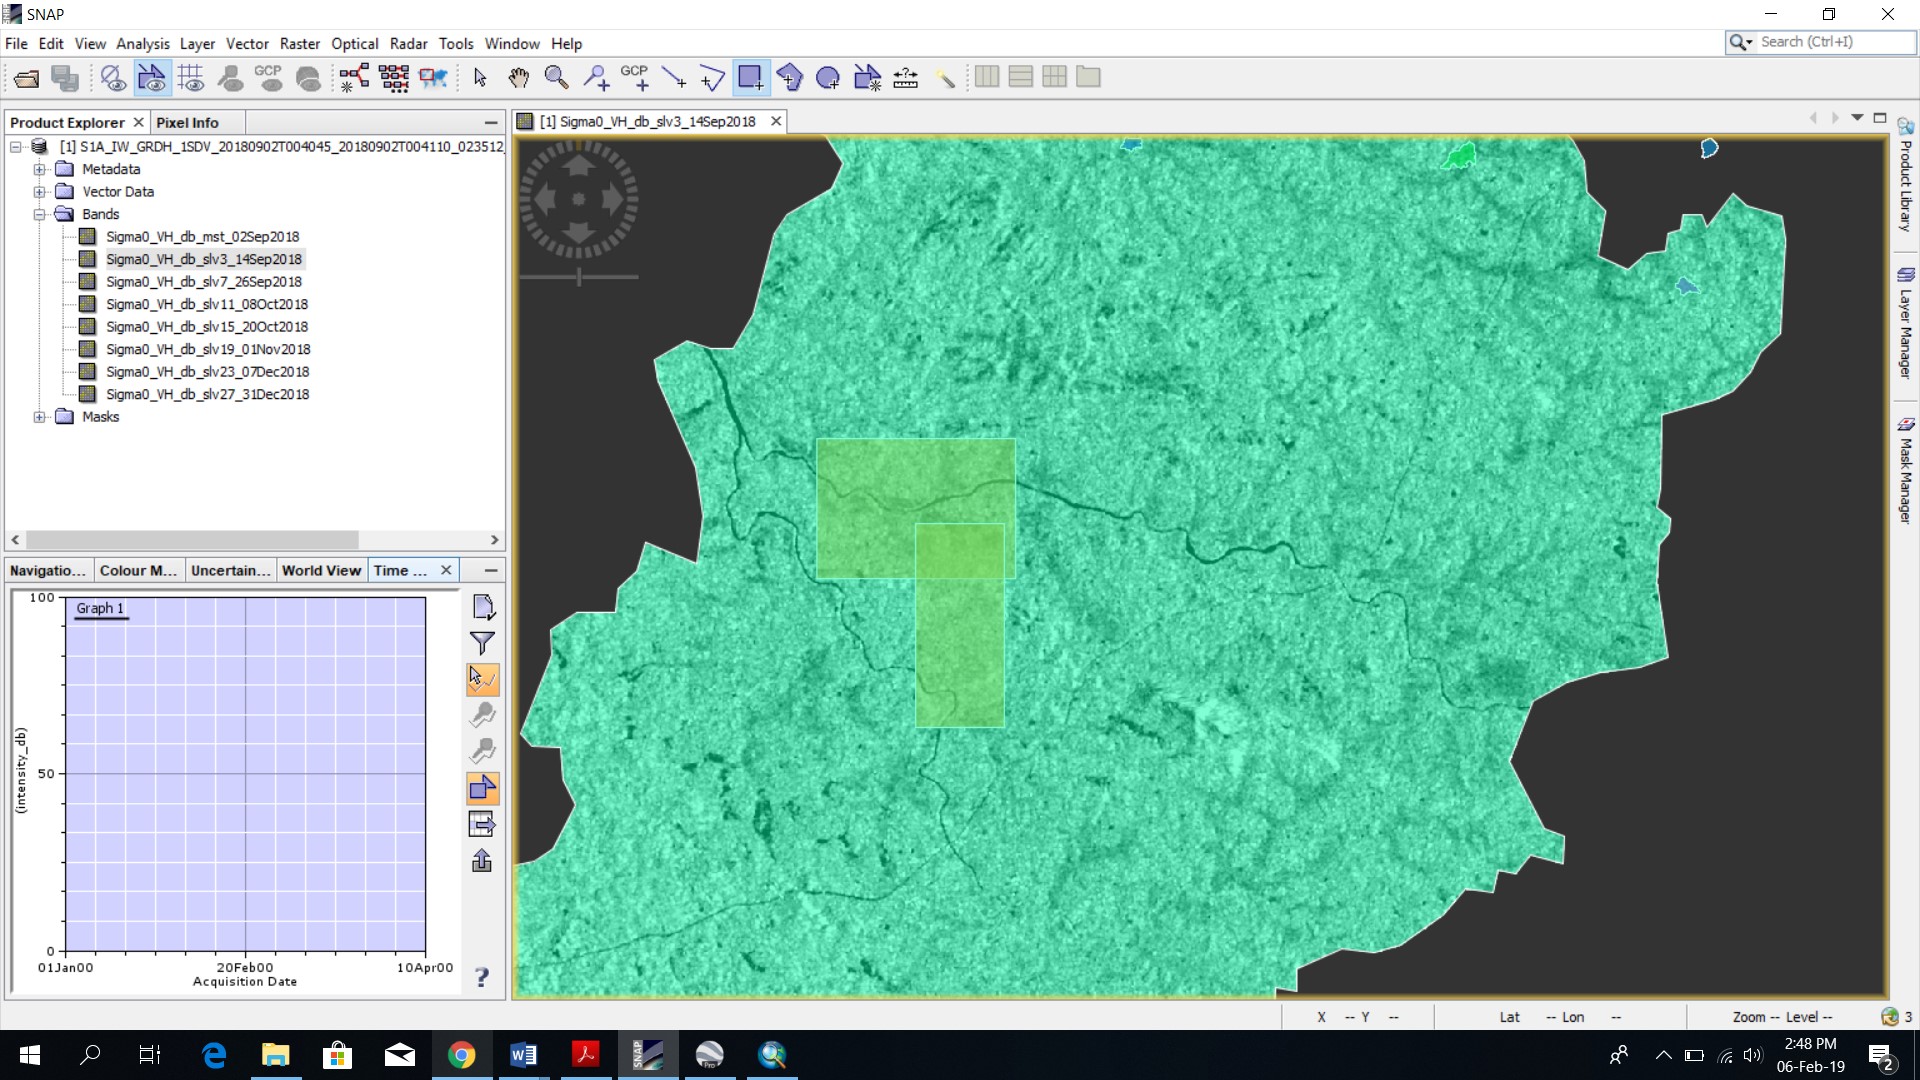
I am using SNAP v.6. I have processed 3 Sentinel-3 OLCI images and I am now checking the temporal profile using the Time Series Analysis tool of SNAP. Everything works fine but I think there is a bug or error when using the "Show average ROI" I click on the icon to define my area (either with a polygon or rectangle) and right after defining the shape SNAP freezes and do not recover so I have to kill the process. This happens both when choosing “average” or “standard deviation”
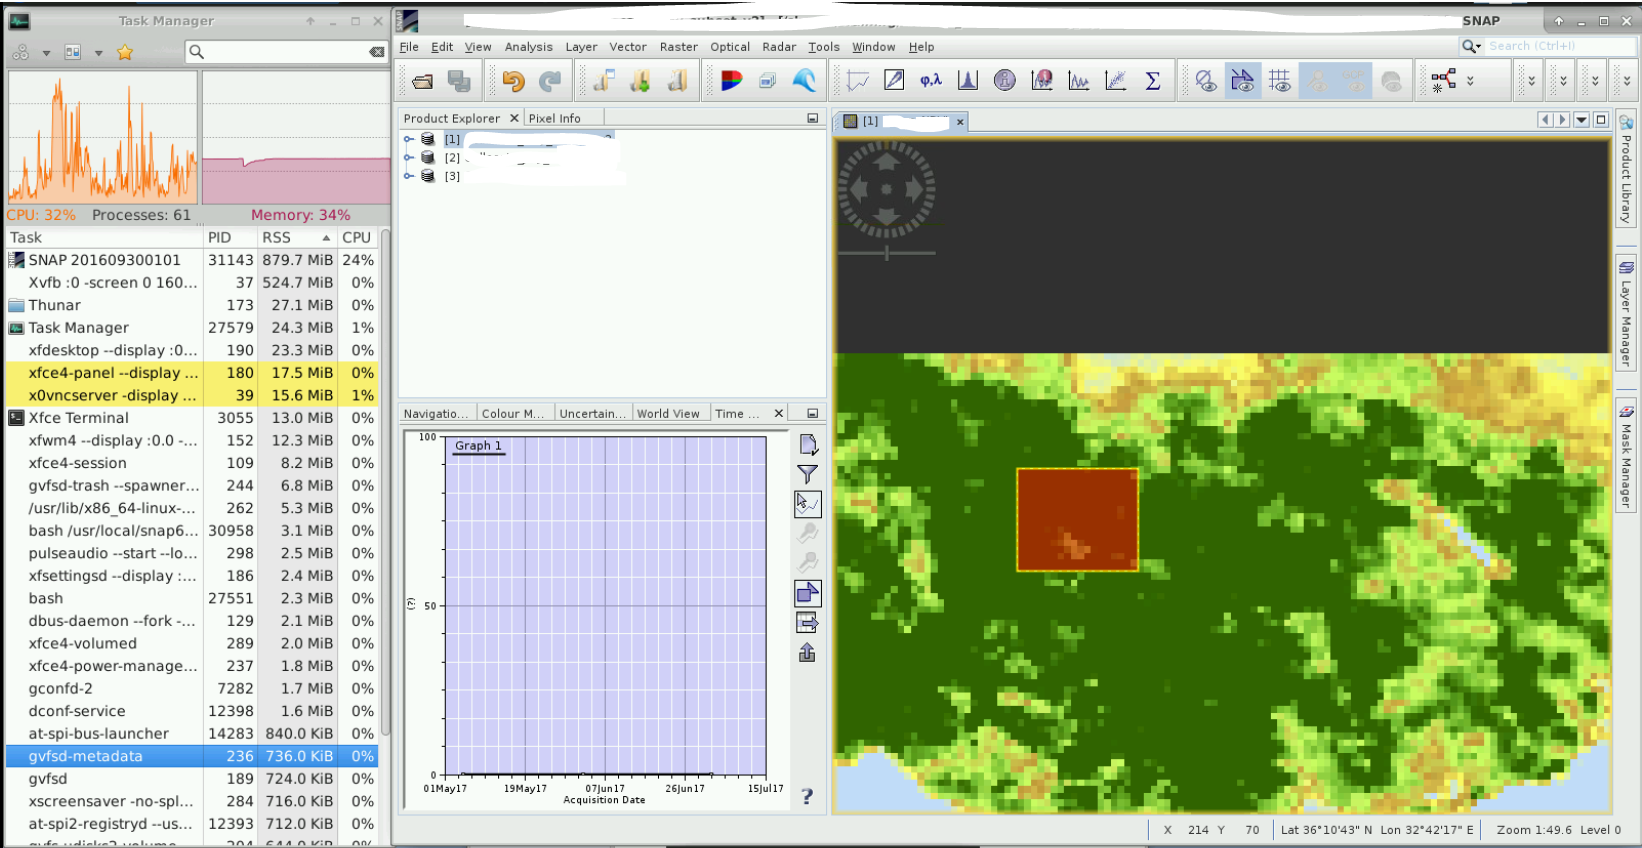
I have tried both in Linux and Windows and I have got the same issue. Is this a known issue?
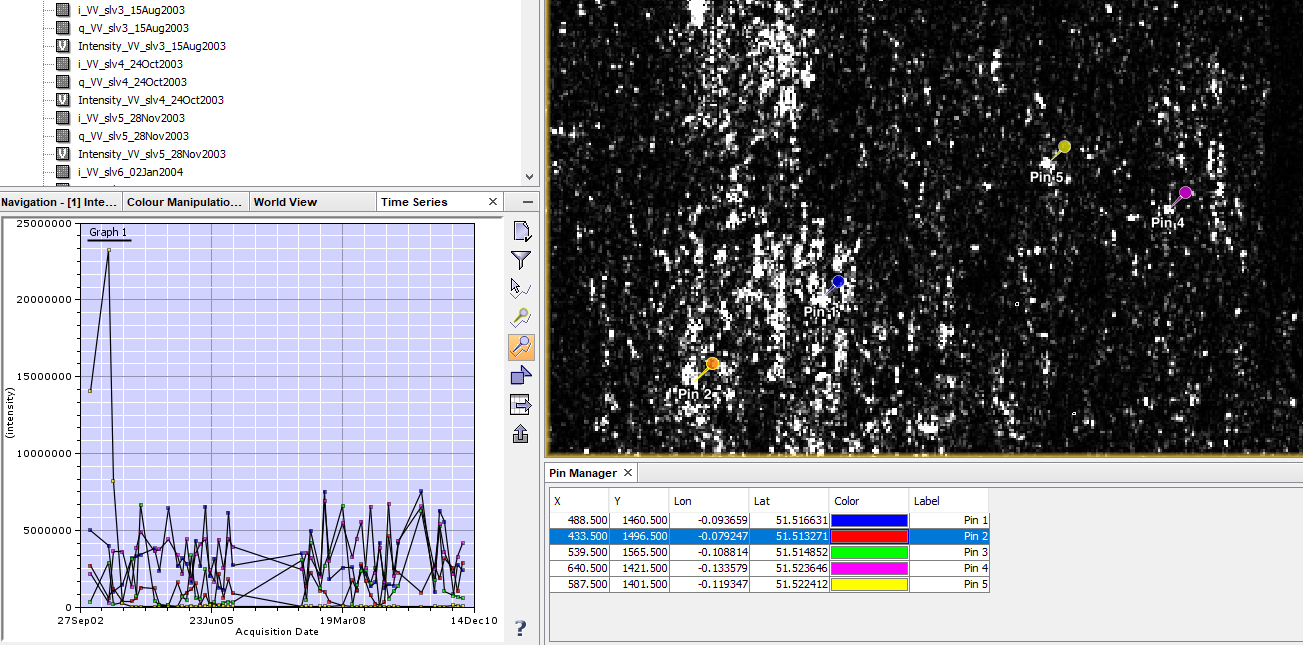
It happens even with very small areas. By the way, the show for selected pins or show for all pins does not work neither. Adding pins in the image and selecting those options does not create the static graph that is suppose to appear.
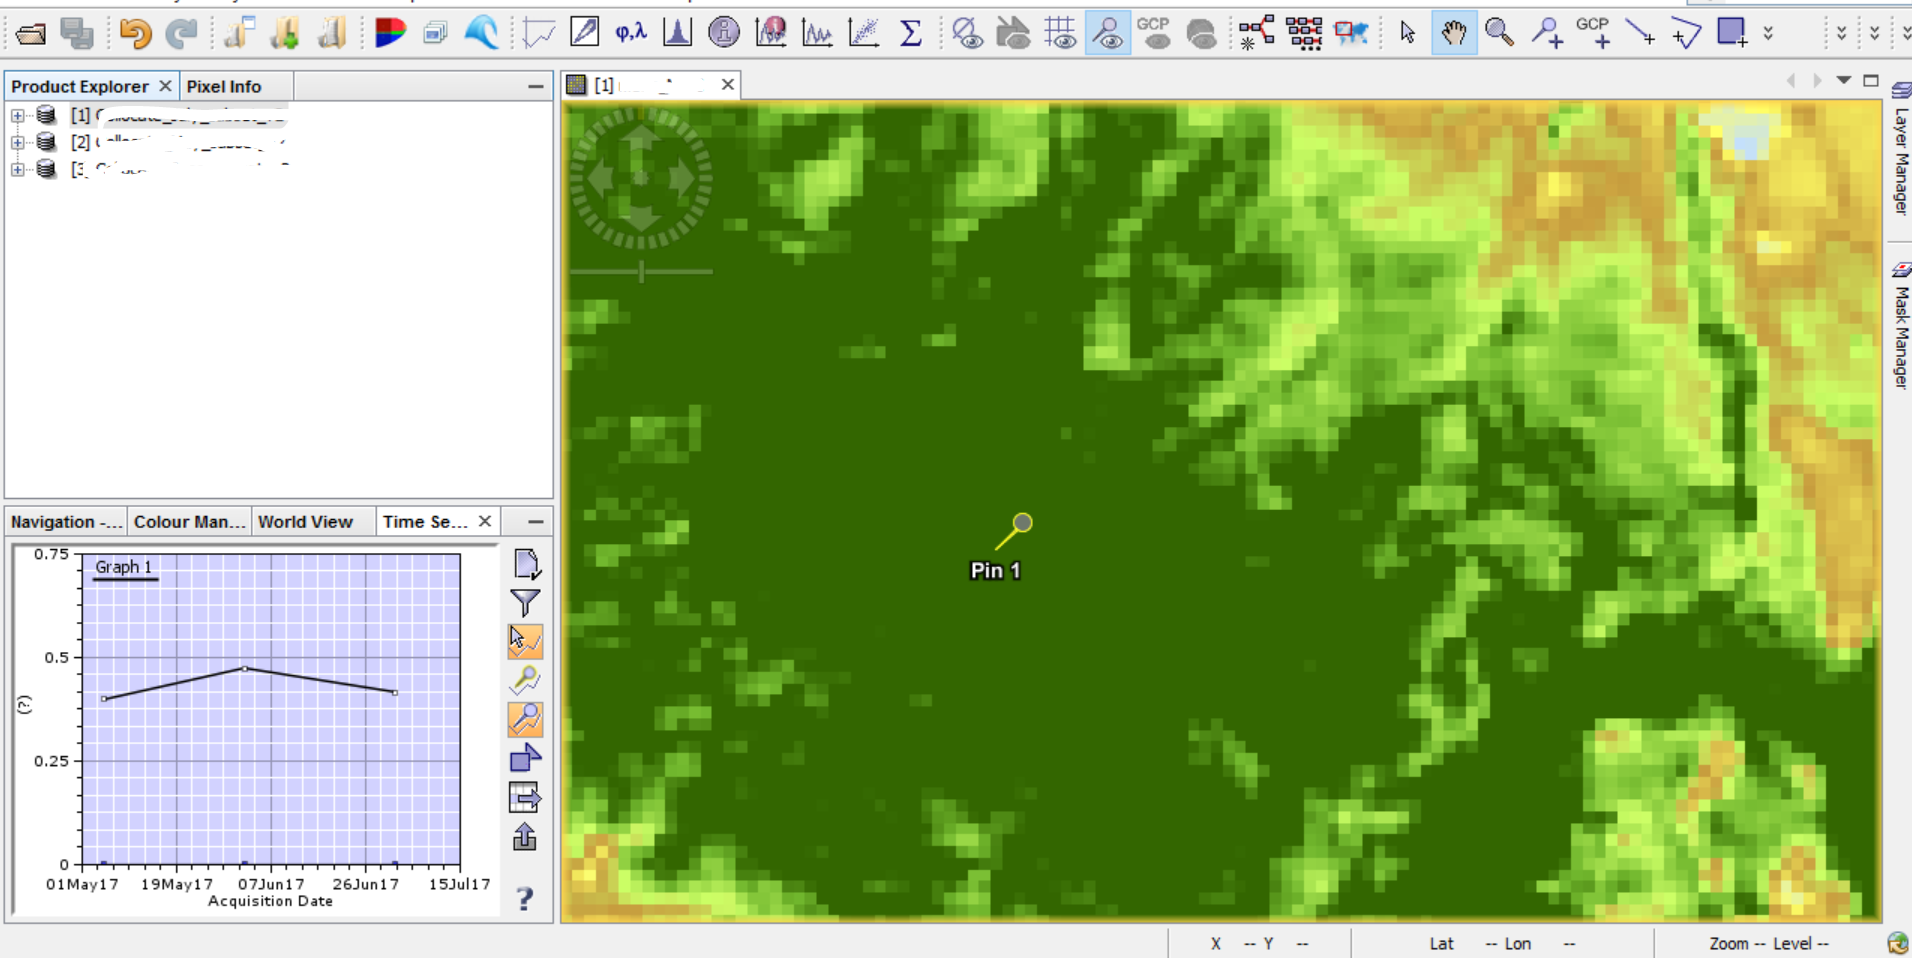
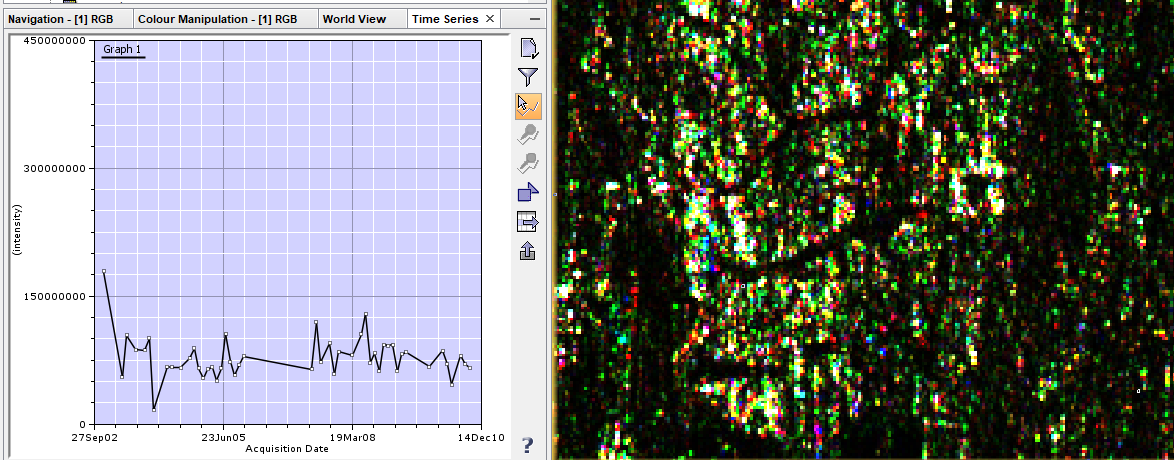
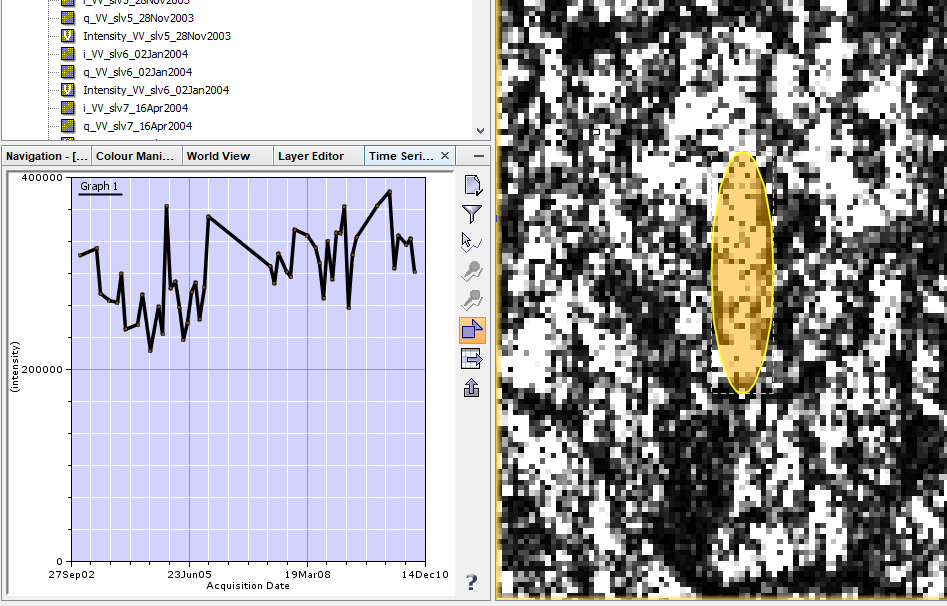
In this image, the pin is located in the image and selected. Any of the two options to show the graph at the pin location works. The line you can see is just the grap at the mouse position when I took the screenshot
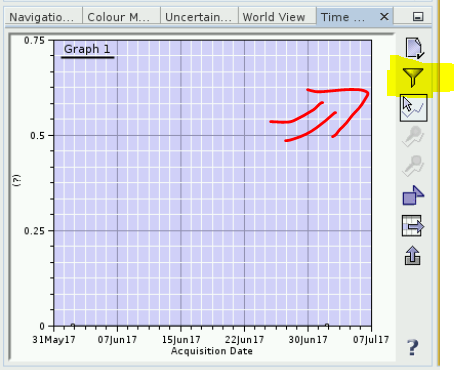
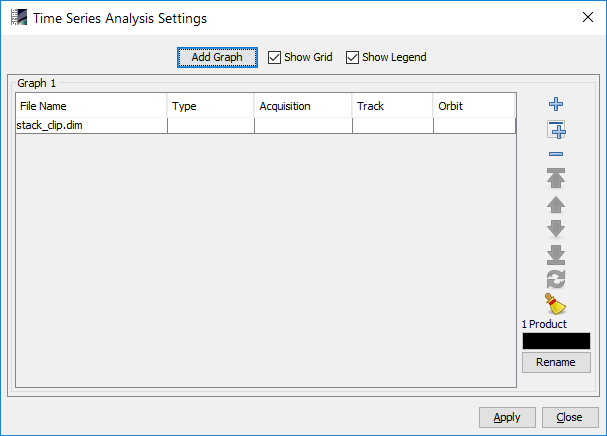
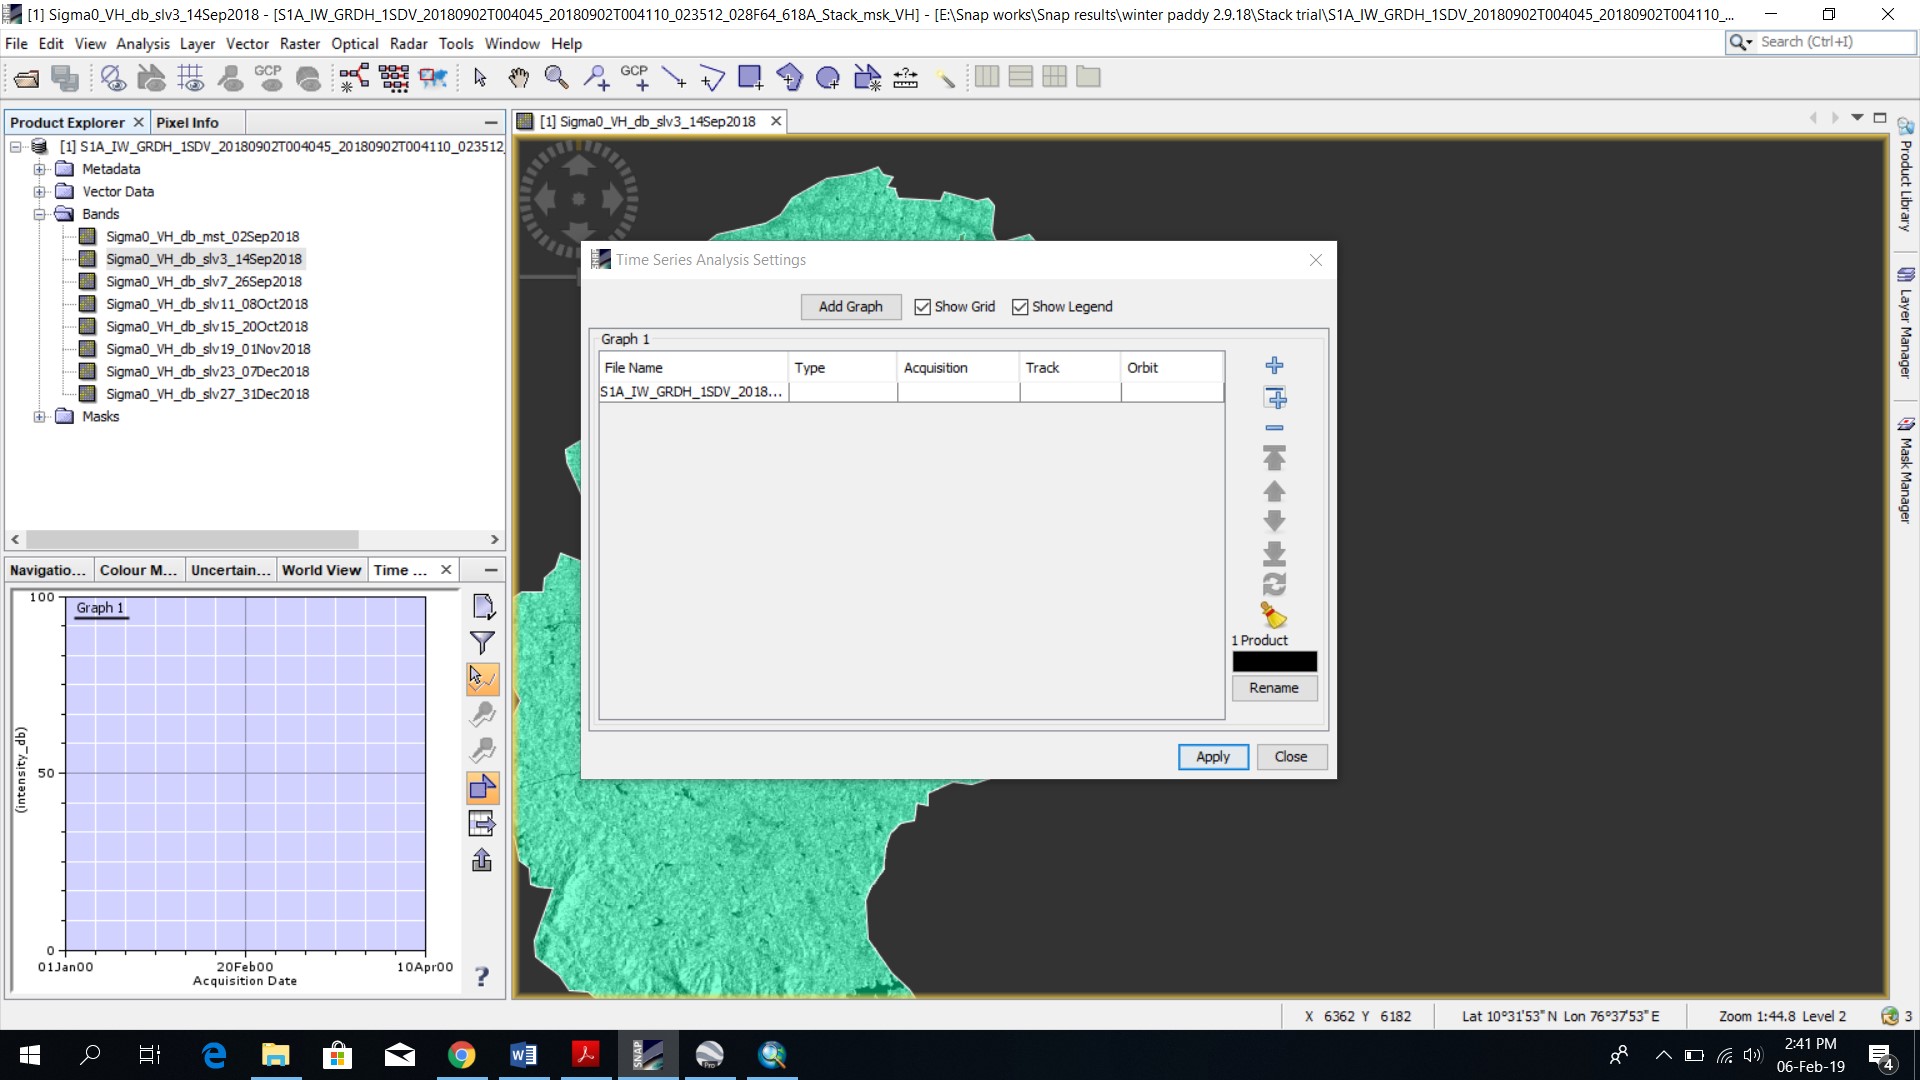
Right after adding the input images to the tool, I use the filter button to select the band that I want to use to show the temporal profile. Afterwards, checking it again only opens the pop-up window to select another band. + If I try to define a ROI, SNAP freezes so no chance to check it again. Not sure I am getting your point.
I haven’t used this particular time series tool. So I haven’t seen this problem before.
This tool was developed for SAR data. It is shipped with the S1TBX.
Maybe it can’t handle spectral data very well. I filed an issue (SITBX-499).
Hi,
I was trying with pins and Sentinel-1 but there is some problem definitely.
Intensity values of my pins are about 0.03-0.05. But when I click on icon “Show for all pins” graph intensity range is fixed from 0 to 100 and no pin-lines are shown (perhaps there is some line at 0-level but it’s hard to tell). If I move cursor over the image again, single line of the cursor-pixel is shown even if the values are close to other pin values.
No, SNAP can only be used to prepare the images as an input for StaMPS software which can perform PSI. Please have a look here: About the STaMPS category
I have the same problem discussed here. Sometimes the time series works well - graph shows both mouse cursor and pins (I was able to get also ROI only couple of times). But sometimes is just stops working and the only thing I get is mouse cursor. I do not see that this discussion came to a solution, did it?
For S1 images it works better, only occasionally it “stops”, but for S2 images I got only the mouse cursor working, not pins. I know it is designed for S1, but if the mouse cursor works also for S2, why shouldn´t also pins work?
In addition, I have never got it working with a stack, only with separated images.


 It might be due to the update done to the plugins installed.