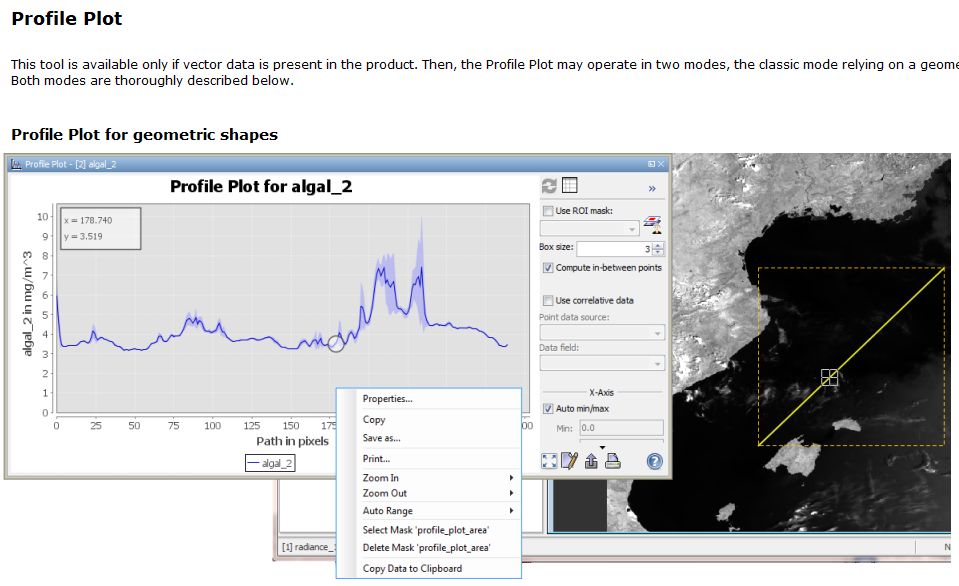
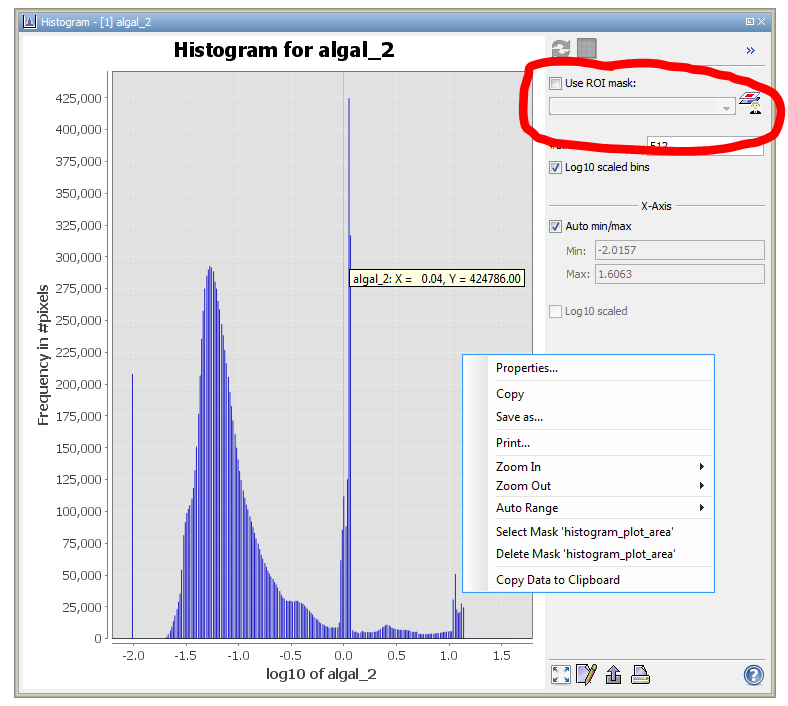
You can either use the profile plot to investigate the backscatter along a digitized line or the histogram tool to investigate the mean backscatter values within a digitized polygon (select ROI mask).
On the temporal scale, you can use the time-series tool which helps to investigate the temporal profile of a pixel, line or polygon:
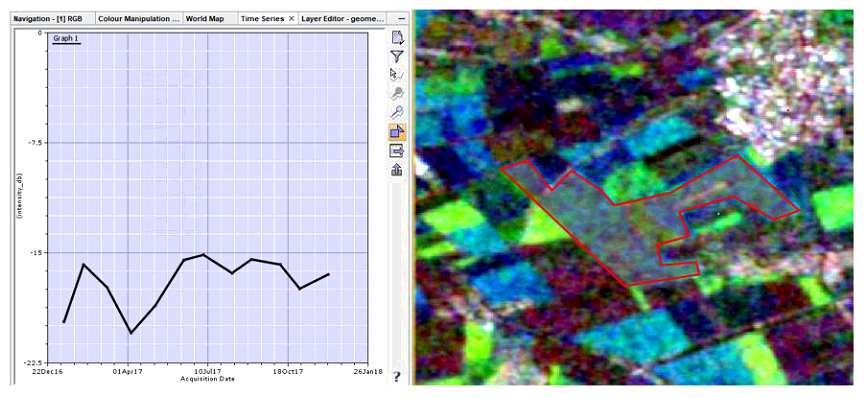
Also see here: SAR Time-series Analysis tool"
and here: Time Series Analysis Tool - Possible Bug
If you have the plot boundaries as a shapefile, you can directly import it as a vector and use this instead.
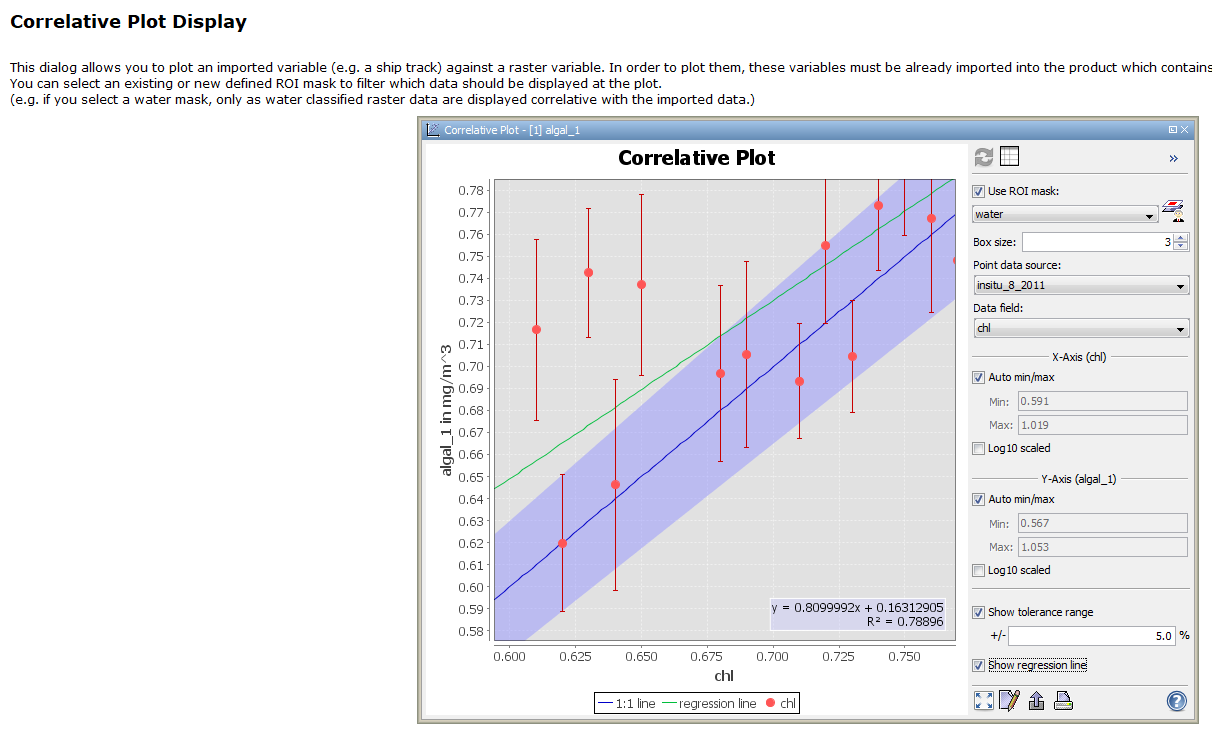
If you have already some attributes in your shapefile’s attribute table, you can use the correlative plot tool
Have a look at SNAP’s help section which explains the tools to you.