Hello, I’m trying to export Leaf Area Index data (Sentinel-2 biophysical indices) from the Time Series graph but the csv file didn’t contain the
LAI data. Please see the attached file.
Barley_Feb_June2020_LAI.csv (272 Bytes)
Hello, I’m trying to export Leaf Area Index data (Sentinel-2 biophysical indices) from the Time Series graph but the csv file didn’t contain the
LAI data. Please see the attached file.
Barley_Feb_June2020_LAI.csv (272 Bytes)
Is the time series displayed correctly in the plot?
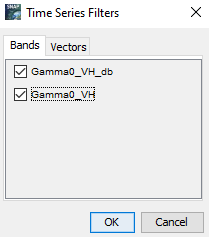
Did you select this band in the filter dialogue?
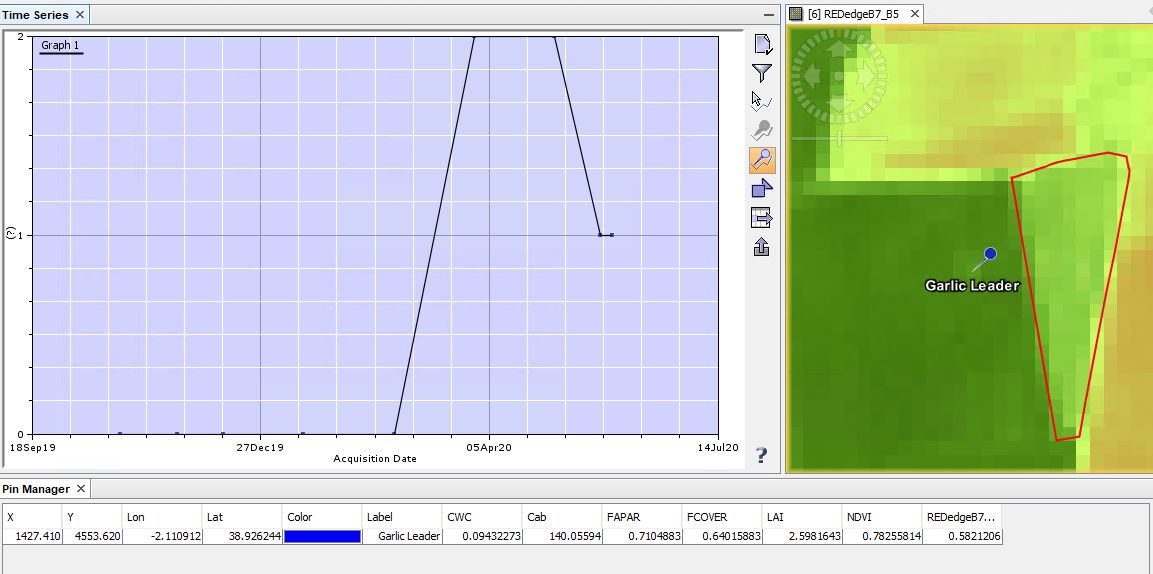
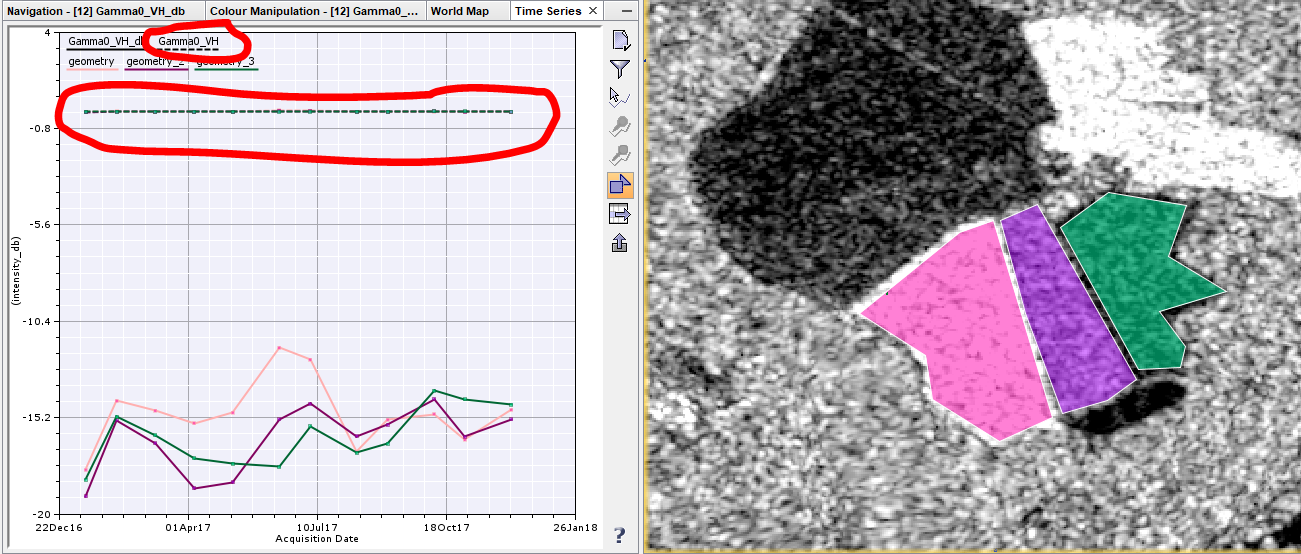
Dear Abraun, sorry for the delay response. I’m sending you the LAI change detection plot (using the pin=Garlic Leader). Even if the LAI is 2.598 (as you see in the image) the axe Y can’t exceed the 2. But when I use the “show at cursor position” icon then it shows me the correct plot of each pixel.
so do you want to export the value of the pin or the AOI?
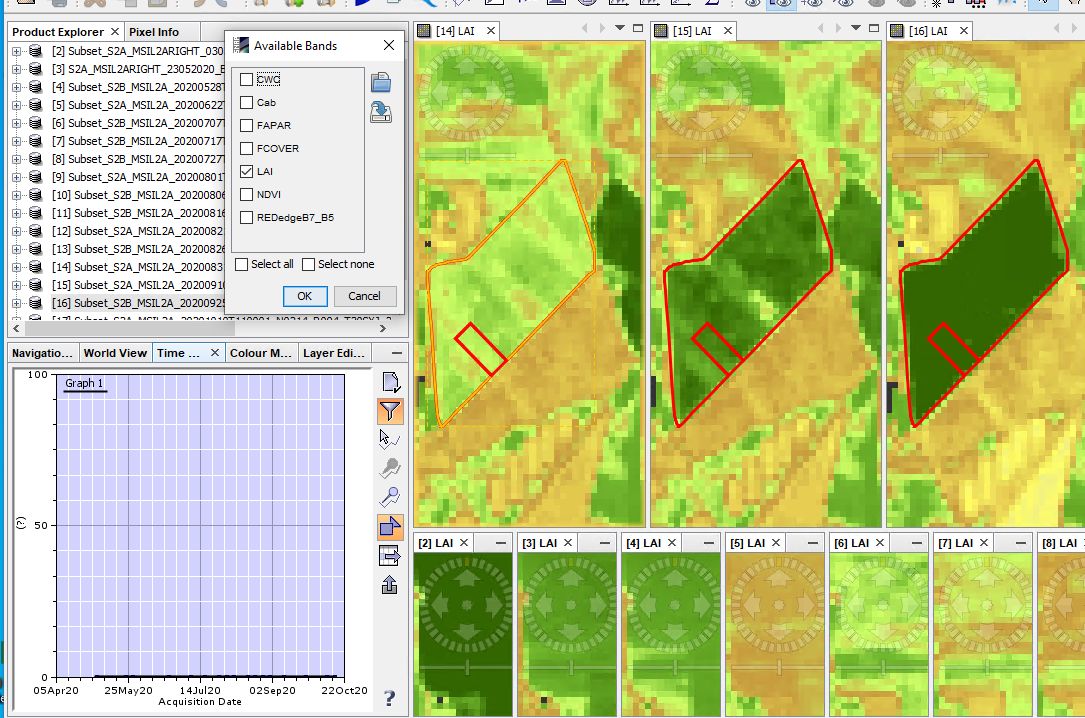
The optimum will be exporting all the biophysical indices (LAI, FAPAR.etc…) from the different crop,(vector layers) AOI but I can’t figure out how to do that (with sentinel-2 time series images). I have imported the vector layer illustrating the crop but afterwards what should I do?
So far I managed to illustrate the plots, for each Index, using pins (as you have seen).
Regards
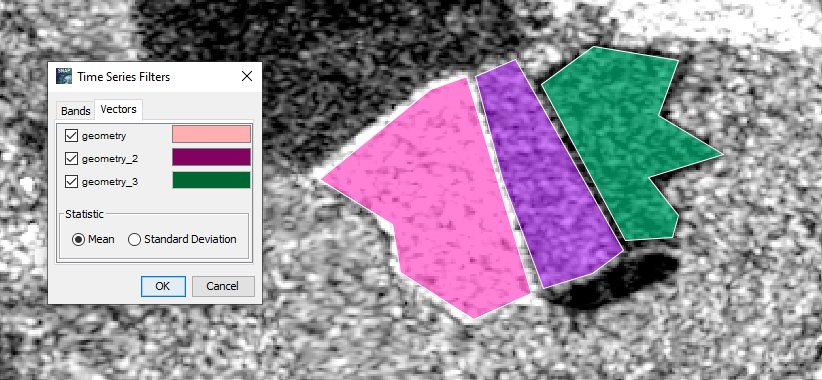
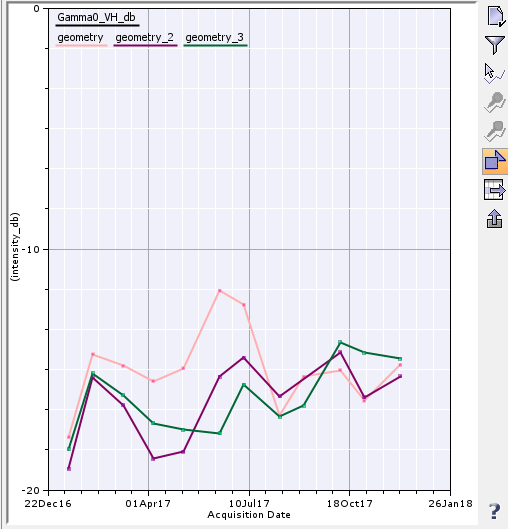
this should be possible. Here’s what I did to get it to work
Plot looks good
Export looks good: graph_multiple.csv
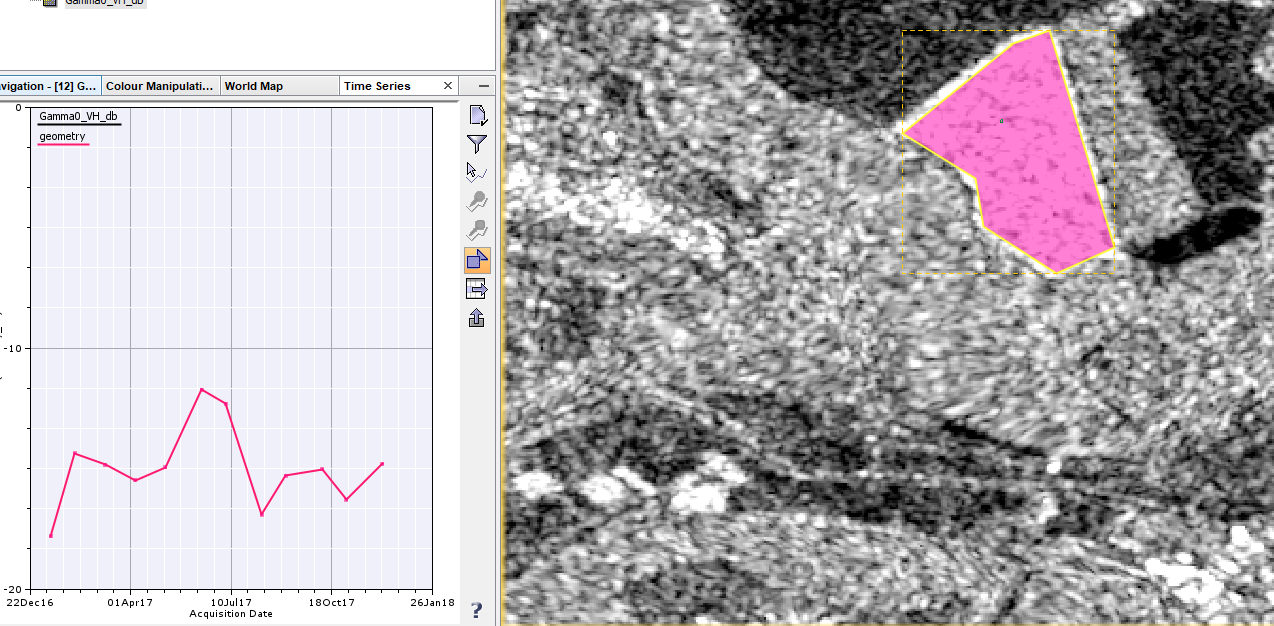
Now I created a second band (consistent throughout all products), Gamma0_VH and added it to the tool
It is added as dashed line to the plot (no variation visible because linear scaled SAR intensity)
Export now includes both in the csv: graph_multiple_bands.csv
thanks for the quick reply. The steps that I followed:
-I loaded 17 images Sentinel-2 (each image 7 biophysical indices)
-I loaded, in each image, vector file with the crops
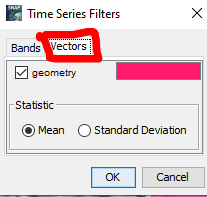
As you see in the attached file the vectors option doesn’t exist.
I have SNAP 7.0
This new option is included since SNAP 8, so it might be worth to update it.