Time series plot for points in 100m radius around the selected point

Hello there,

I am running the ts command in Matlab, which is shown as follows:
ps_plot(‘v-dao’, ‘a_linear’,‘ts’)
Deramping computed on the fly.
**** z = ax + by+ c
1 ref PS selected
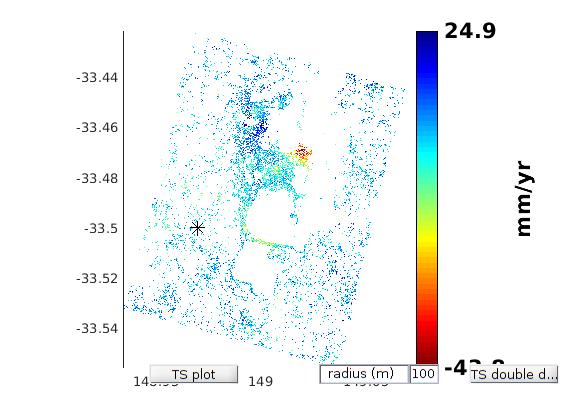
Color Range: -43.7648 to 24.9226 mm/yr
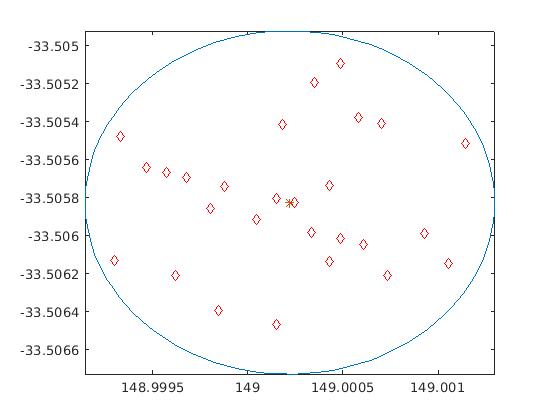
Please select a point on the figure to plot time series (TS)
Selected point coordinates (lon,lat):148.9953, -33.5041

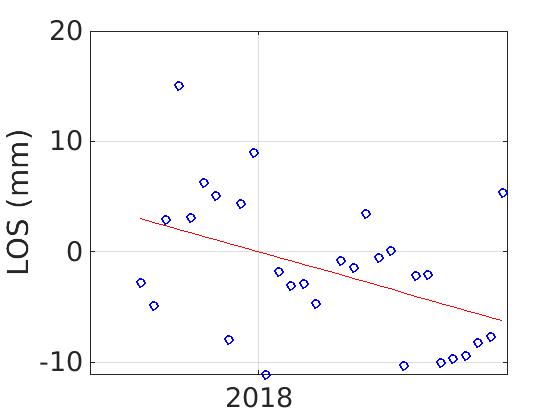
The plotted result was strange. The velocity of associated points doesn’t follow a linear pattern.
1
2
3

Any ideas of how to fix this? I really appreciate any help you can provide.

1 Like

This is not a technical error, but results from the data quality. It can have several reasons:

  • the points you selected in the 100 m radius have different displacement patterns
  • there is too much noise in your data

If you click on areas with denser PS distributions the temporal graph will have a more linear shape.

Thank you so much for your suggestions. Really appreciated. I will see how it goes based on the two points you have given.

is it possible to type the coordinates where the ts plot is desired instead of roughly choosing it by hovering the pointer over the velocity plot