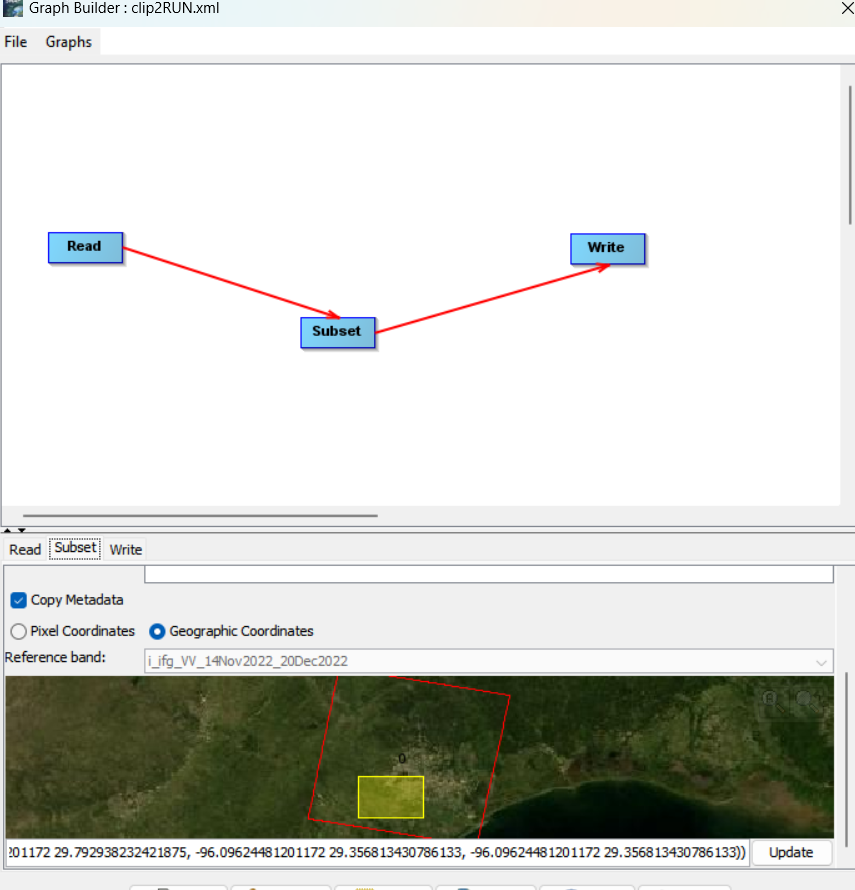
I am trying to clip a Sentinel-1 Interferogram, I am attaching my graph below:
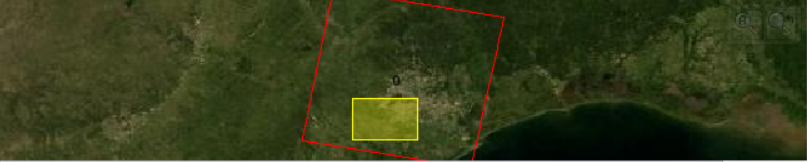
expected output should be the yellow region
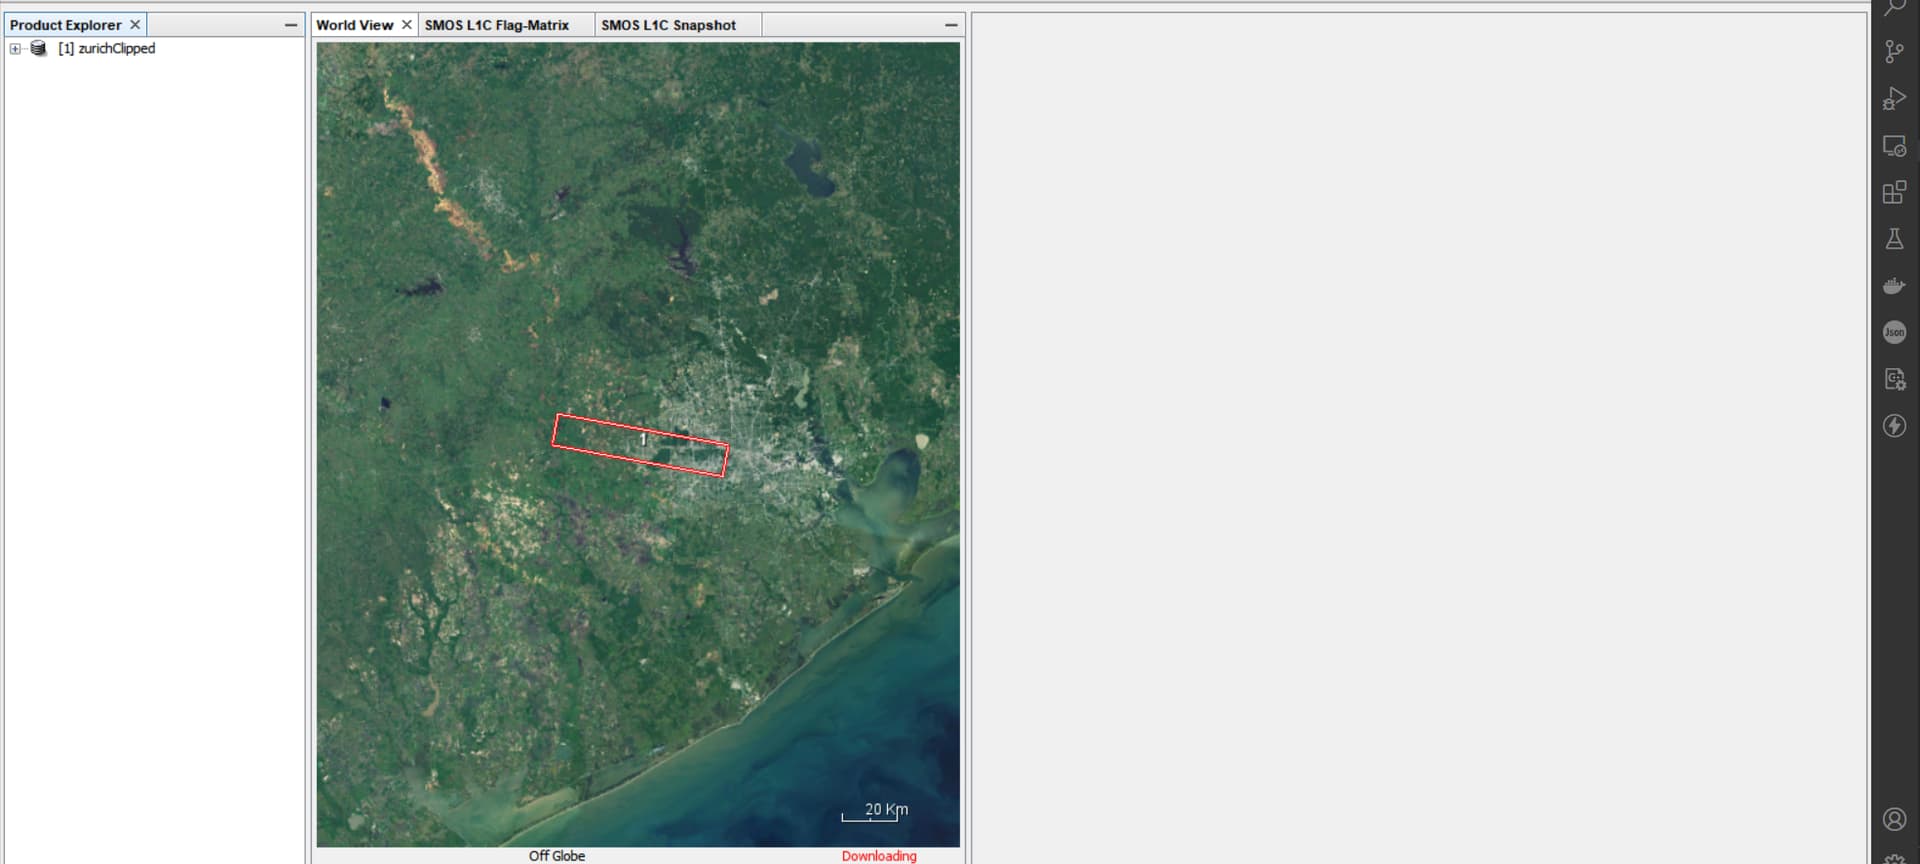
but after running the graph the output looks like this:
can anyone help?