Too bright image or wrong resolution

Hello. This is the first time I use Sentinel Toolbox and Sentinel data.

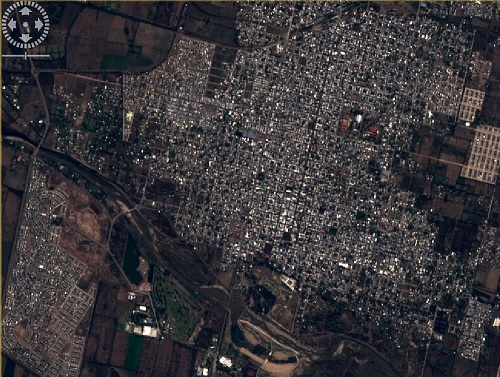
I’m trying to get an RGB image at 10m resolution of a city, and I get a very bad result.

It looks like too slow resolution and the city blanked close to white color.

Maybe I’m doing something wrong, so I would like to know if I need to make a correction to the image, or maybe I unknowingly are not using the 10m data but 15m or 30m?

I’m interested on the city of Villa Mercedes, San Luis province, Argentina.
(here is a kmz file, if you want to know city límit.kmz (700 Bytes) ).

I downloaded this 6 Gb file, because is the most recent cloud-free:
S2A_OPER_PRD_MSIL1C_PDMC_20160608T044243_R010_V20160607T143134_20160607T143134

The documentation I found online, as I understand, says that it contains data from Sentinel 2, all bands including blue, red and green, at 10m resolution.

I suspect that I made a mistake and used 15 m, or downloaded the wrong file

To generate the RGB image, I opened SNAP Desktop, and since it does not opens the zip file, then I uncompressed the file, and opened the xml file in the subdirectory
S2A_OPER_PRD_MSIL1C_PDMC_20160608T044243_R010_V20160607T143134_20160607T143134 .SAFE\GRANULE\S2A_OPER_MSI_L1C_TL_MTI__20160607T204534_A005012_T20HLG_N02.02

I got this message “Multiple readers are available…”

-So, I choose “10m resolution”, expecting the Toolbox to read 10m resolution data.
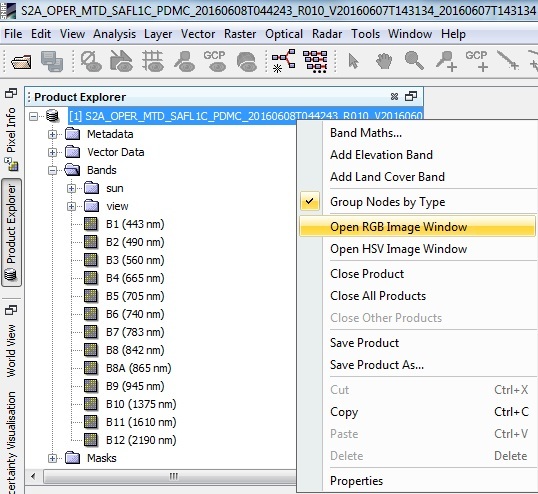
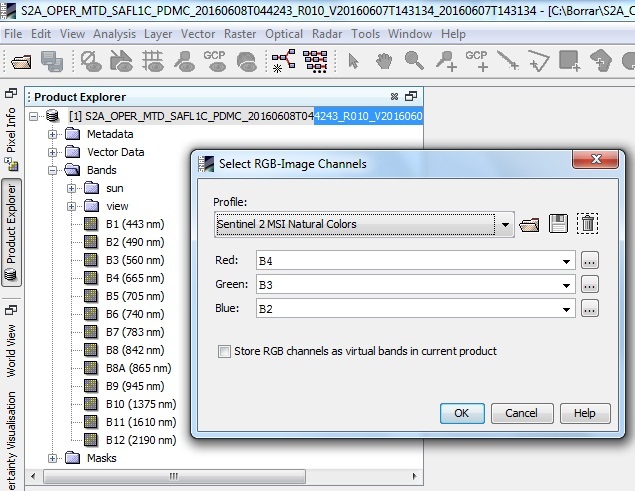
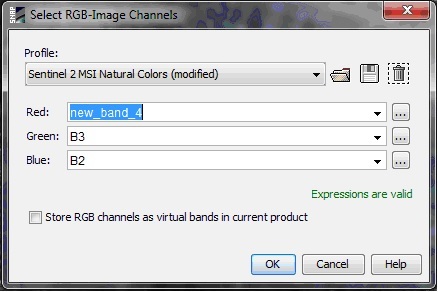
-From the Product explorer, I right-clicked on the packet, and choose “Open RGB image window”, and I left the default RGB channels, B2 for blue, B3 for green, and B4 for Red. because I had read that those are the correct ones.

The problem is that it doesn’t looks like a 10m resolution, but lower, and the city is too white so details are all lost.

here is a comparison of the result, with another image with same resolution, from a different satellite, which is the kind of result I expected.

¿maybe I should open the data with a different method?

¿Maybe I should do some previous preprocessing/calibration/adjustment?

As a new user, I’m only allowed to post one image per post, so there is what I mean by “right-clicked on the packet, and choose “Open RGB image window”

Then I choose this default bands:

Hi,
Have you tried to use the Color Manipulation tool?

Regards,
Gonçal.

Please, somebody correct me if I’m wrong or inaccurate.

Computer graphic files do not represent light intensity linearly, but represent the square root of light intensity (that’s a technical fact), because human eyes have a logarithmic sensitivity to light.

So, I suppose that light intensity on Sentinel 2 data is linearly represented (the number is proportional to light intensity), and to convert to standard RGB graphic formats, is necessary to take the square root of each band before combining them.

That’s why the Sentinel toolbox RGB routine produces an overexposed image?

I saw the menu for making math calculations with the bands, but cannot figure how to use the results to combine into a RGB file, because I cannot group the output files to use the RGB tool, and the RGB tool does not allow selecting arbitrary files as R-G-B source (I guess because they are not georeferenced?).

Hi,

As suggested by GonGrau, the problem is that with the default values used for the histogram stretching, the pixels within the city seem to be saturated. These default values are selected to skip the 1% area on the left and the 4% on the right of the histogram.

You can manually modify the values in the colour manipulation window. If you select a maximum value of 0.35 in R, G and B bands, the result should be something like this:

On the other hand, WobeDeney, it is possible to open the Sentinel 2 product and compute the new bands with the Band Maths tool for creating a customized RGB profile. In the combo for each band, the new bands should be available:

Regards,
Omar.

1 Like

Sorry for the delay answering. I had a large holyday.

Thanks. I tried the color manipulation tool, and it solved the problem.

For resolution, I see that is the expected 10m. I wonder if more resolution can be extracted if the RGB bands do not belong to the exact same points. Maybe using some deconvolution.
As this thread shows, the satellite moves a lot between band recordings, so how they match the location for the pixels of each band? There must be some displacement between bands.

Since the computer monitor can only represent 256 different colors for each band, some transformation is necessarily made, but I don’t know which one. Maybe it already takes the square root, o a logarithm (but in which base?). I searched in the documentation, but found nothing.