Is there documentation for the Uncertainty Visualisation tool window? It is accessible from the View menu; I’d like to know whether it can be used with SAR data, but can’t find any examples.
Unfortunately the tool is not yet documented.
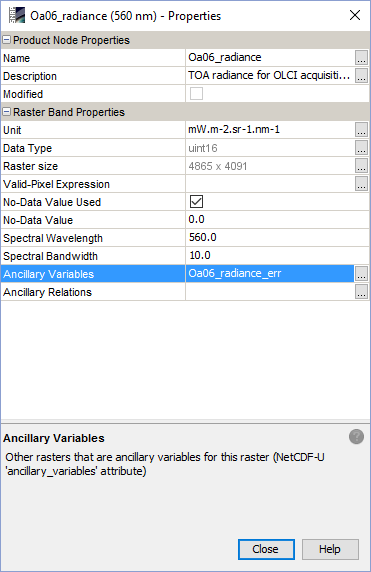
But if you have one band B and a band U, where U provides the error or uncertainty you can use the property dialog of band B to associate U with B. Just select U as ancillary variable of B.
2 Likes
It could be used for SAR data such as viewing an interferogram and using the coherence as the uncertainty.
However, there doesn’t seem to be an easy way to flip the direction (low coherence should mean high uncertainty).
The only place this can be changed that I know is in the table but then the sliders get messed up. A check box to flip the direction would be nice.
2 Likes
Coherence as an uncertainty band for an interferogram is an interesting idea (I wonder if virtual band maths could perform any necessary scale flipping).
I was particularly thinking about orthorectified SAR, where the spatial resolution differs between foreslopes and backslopes.
Yes flipping the direction is needed