What is the best way to perform the conversion of units for Sentinel data? I have used an equation in the past to properly convert other C-Band data, but this is the first time I am using Sentinel data. What is everyone using? And are you converting the data to cms, for example, in SNAP, or in ArcMap, or another software. Let me know!
There are more then one Sentinel satellites up there. About which one are you talking? Sentinel-1?
In this case, I am using Sentinel-1A data.
Any Ideas?
what do you mean by “conversion”?
Did you see this suggested workflow?
By “unit conversion”, I assume you mean creating a new band from existing bands using some math equation. If that’s the case, you can use the Band Maths function of the tool by right clicking on the band name and selecting Band Maths in the popup menu.
The wrapped and unwrapped resulting images are in radians. I would like to see the unwrapped images in centimeters, for example. Other interferometry software I have used does not convert the images, so I had to use an equation proper for C-Band to do the conversion. With this new SNAP software, is there a way to get unwrapped images in centimeters with an tool? Or is there a specific equation I can apply for Sentinel-1a data?
Then you can use the phase to height or phase to deformation function in the toolbox for your application
Hi Junlu, Once I have successfully unwrapped, I have an image that is in radians. The next step is to apply the Phase to Displacement tool. After this tool runs, what are the units for the displacement image?
The last step before exporting to a Geotiff is to run the Range-Doppler Terrain Correction. Once this tool runs, what units is the new terrain corrected image in?
After running both of these, exporting to a Geotiff in WGS84 so I can view and analyze in ArcMap, it looks like the units (displacement values) are in meters, but nothing tells me that. WGS84 has pixel spacing in meters, but what are my pixel values in?
I am reaching out to you since you are the author of the Phase To Displacement Operator and the Range Doppler Terrain Correction Operator.
1 Like
Hello did you solve the problem?
The unit is meter. You can check the property of the displacement band by right clicking on the bandname. Terrain correction will not change the unit of the band. So the terrain corrected displacement should still be in meters. Sorry about the confusion. I will update the on-line help to clarify this.
2 Likes
Hi @junlu,
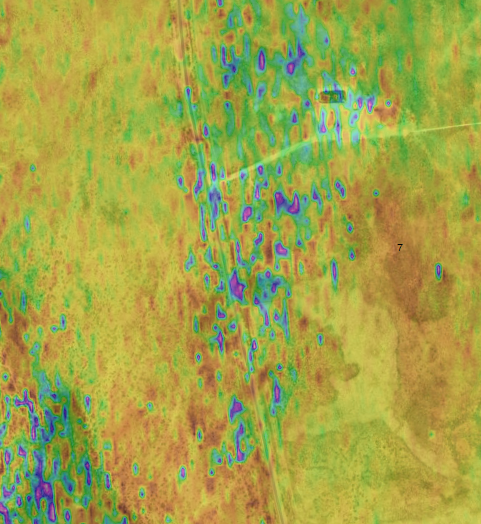
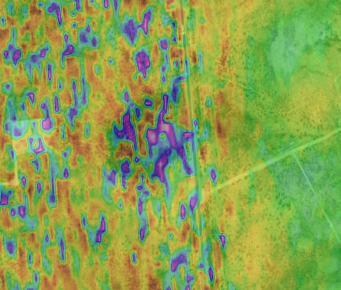
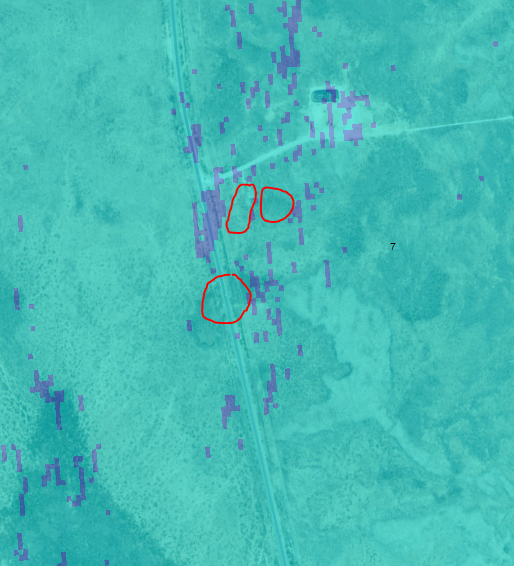
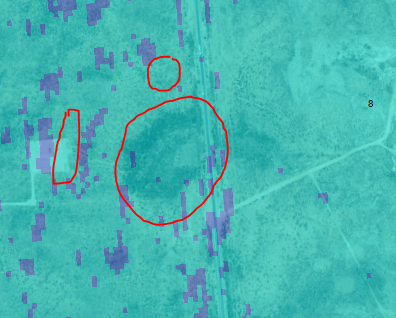
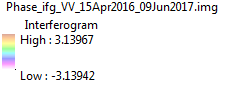
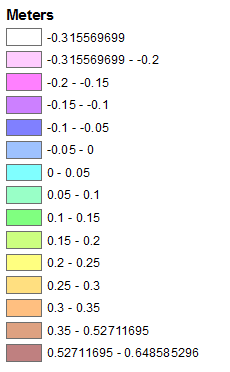
Ok thanks for letting me know. I am comparing the interferogram with the corresponding displacement image and there are a couple key areas that should show up differently in the displacement image. If you take a look at the displacement images, you can see that the circled areas are not reflecting the activity I am seeing in the corresponding interferogram. These are the worst areas! The interferogram show a full color cycle in these areas, meaning that there should be around 2.8cm of change since I am using Sentinel 1A SLC data. However, when I check the values in these areas using the displacement image, the values range from .8 to 1.1 centimeters. Take a look at the pictures and let me know if you have any thoughts on what’s going on. The worst areas are not even showing up in a differnt color at all. The displacement values in the legend are in meters, as you said.
did you check coherence over the circled areas?
Yes, looks good.
I’m a bit confused because the scale of your map is -3.1 to +3.1 and the name is Phase_ifg_VV…
Did you perform Topographic Phase removal and unwrapping on your interferogram?
Here is the recipe I followed for the interferogram below:
Coregistration
Use RGB window and stack Overview to check coherence
Interferogram Formation
Tops Deburst
Topo Phase Removal
Phase Filtering
From there I unwrapped the result, the recipe I used is below:
Snaphu Export (Defo, MCF)
Used Snaphu to Unwrap
Snaphu Import
Phase to Displacement
Terrain Correct
Export as Geotiff
Now I am looking at both results in ArcMap. I did Terrain Correct the Interferogram afterward so i could view it in ArcMap. I later figured out that you can export both the interferogram and unwrapped image at the end.
Thank you very much for helping me out with the details as I am learning this software. Much appreciated.
ah, I see…
What kind of change did you expect at the circled areas? What happened there between 2016 and 2017? Sorry if I overread it somewhere.
Well the interferogram has around 1 color cycle of change in those spots and Sentinel 1A is good to show 2.8 cm per color cycle. So, I would say that there should be around 2.8cm of change there, when right now it is .8 to 1.1cm of change. Now, I do understand that I still need to get Absolute Displacement by finding a zero and subtracting that value from the whole image. The problem is that these areas have the max change according to the interferogram, and the displacement image is showing almost nothing. That’s a problem. To me something didn’t work correctly during the unwrapping.
I can’t really explain where this is or what is going on there, but there should be change. Regardless of any of that, the displacement image is inconsistent with what the interferogram is telling me strictly based on the satellite capabilities.
@junlu - Would you be able to give the previous messages above a look please?