Hello all ,
I have used C2RCC for sentinel 2.
How can i determine the valid and un valid pixels to remove it?
Thanks in advance.
Mona
Hello all ,
I have used C2RCC for sentinel 2.
How can i determine the valid and un valid pixels to remove it?
Thanks in advance.
Mona
Hello Mona,
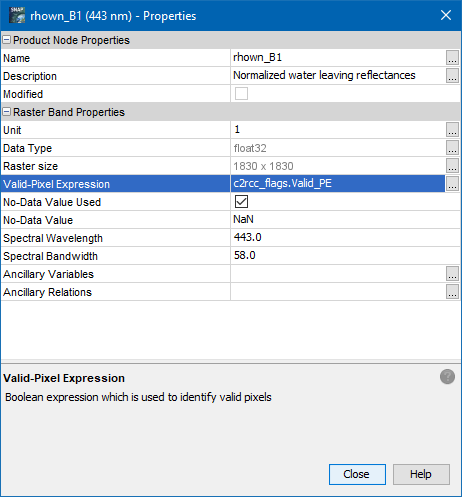
You can set the valid-pixel expression for the band.
The expression would be: “c2rcc_flags.Valid_PE”
This information gets lost when using NetCDF4-CF as output format.
It is kept by default when using BEAM-DIMAP or NetCDF4-BEAM.
Hello marpet
Thank you so much.
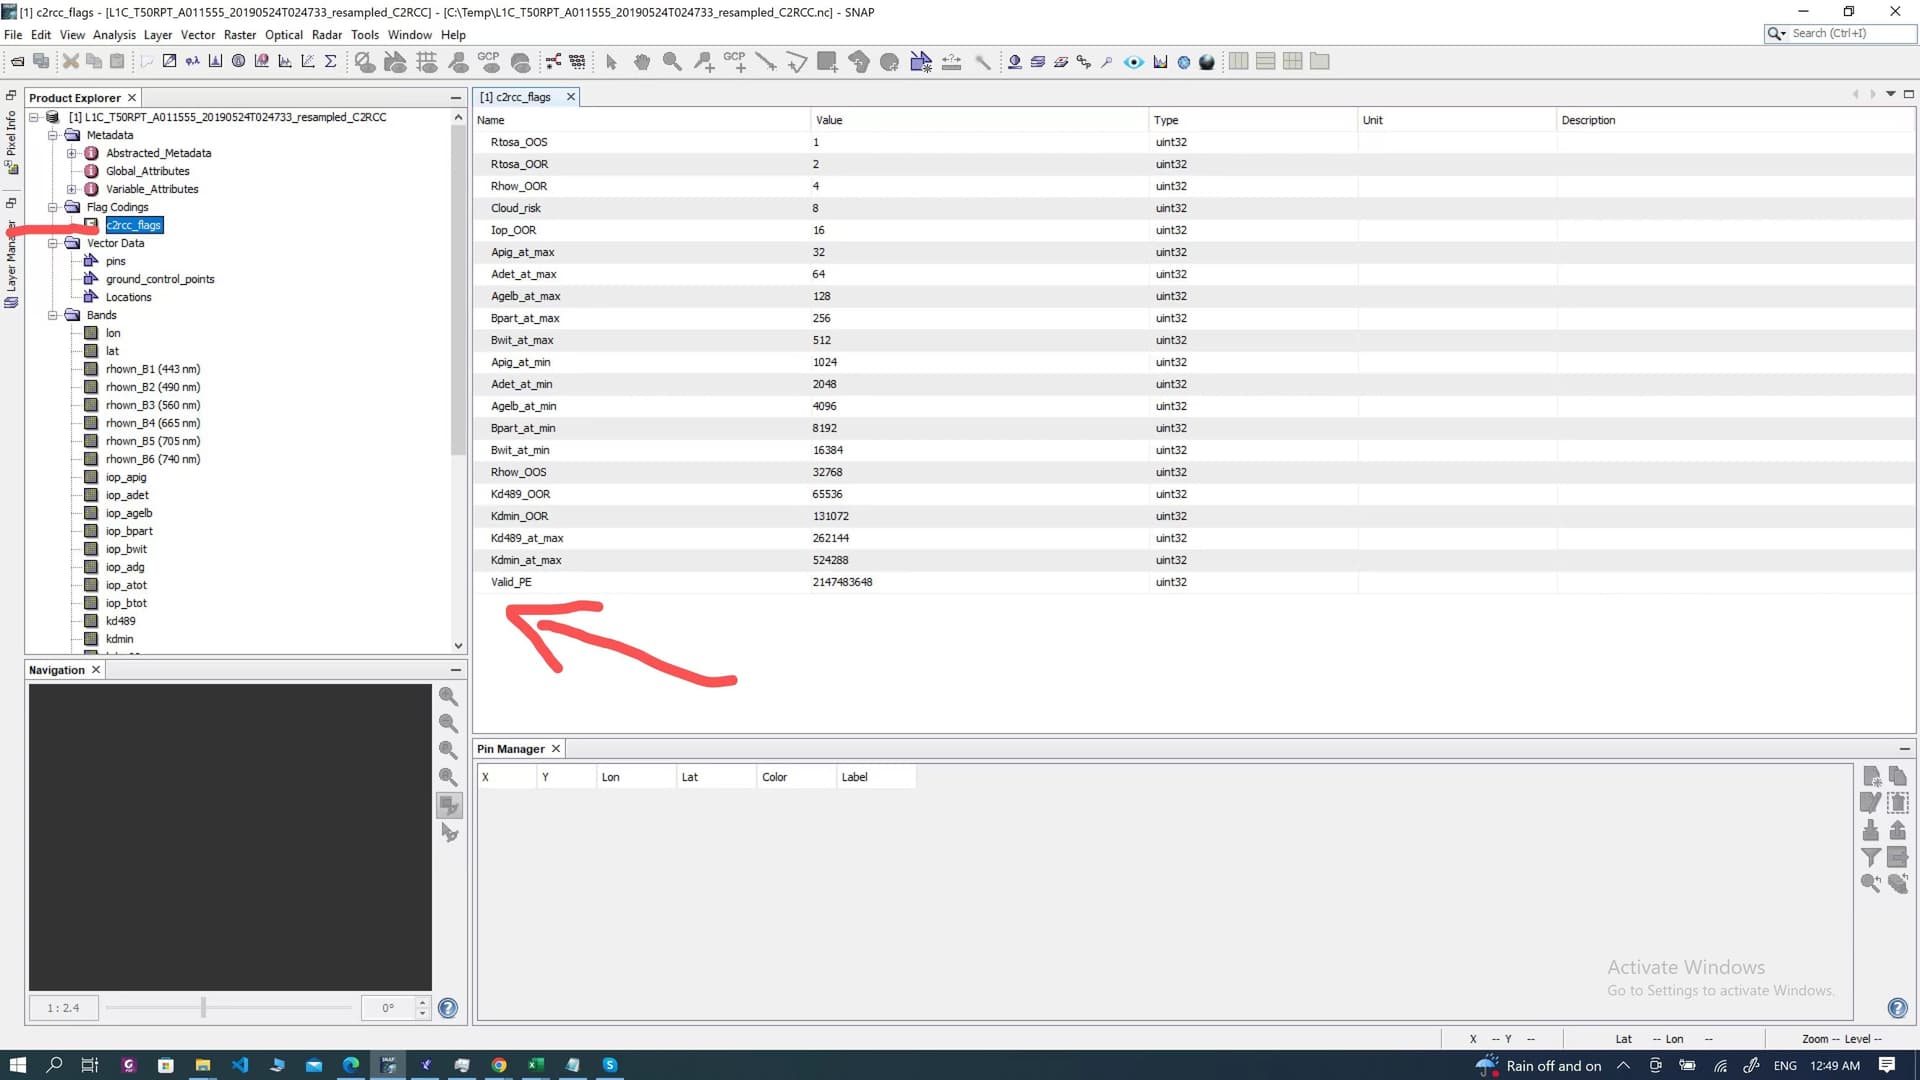
My target is to determine the un valid pixels from all bands and remove it or exclude it . so i tried to export the values of C2RCC_flags at my samples.
According to the C2RCC_ Flags, the value of Valid - PE is 2147483648.
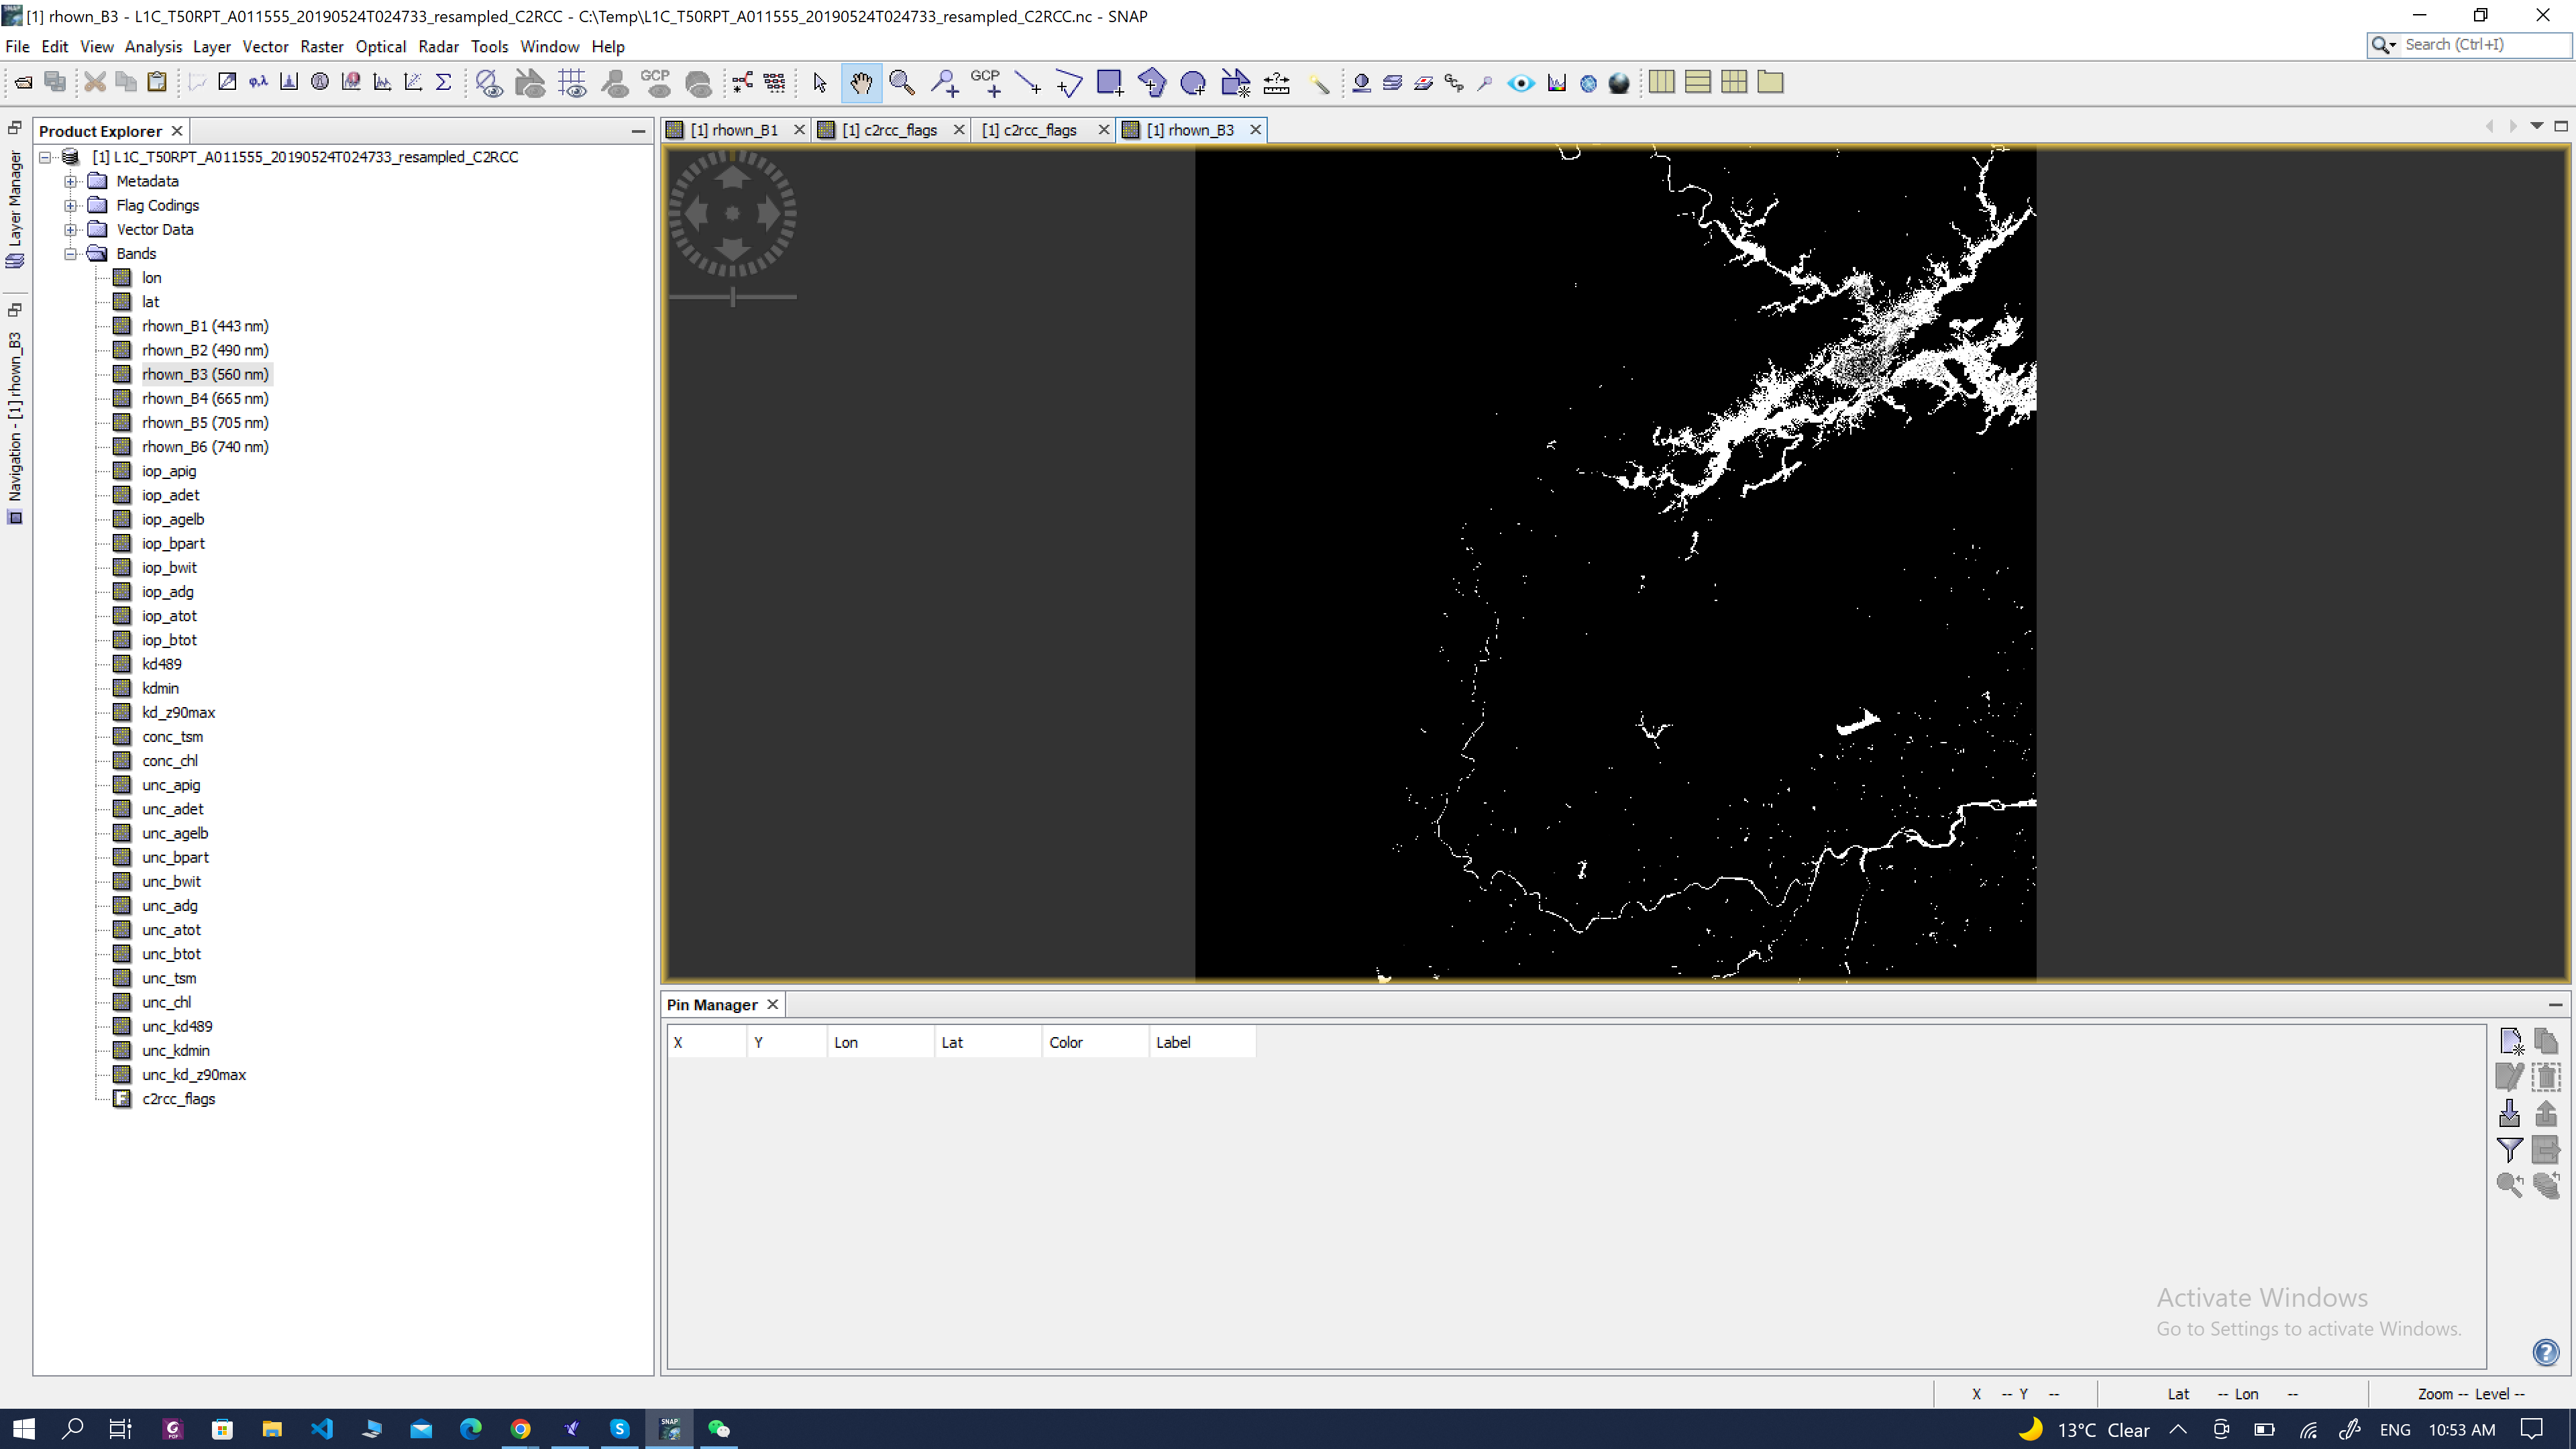
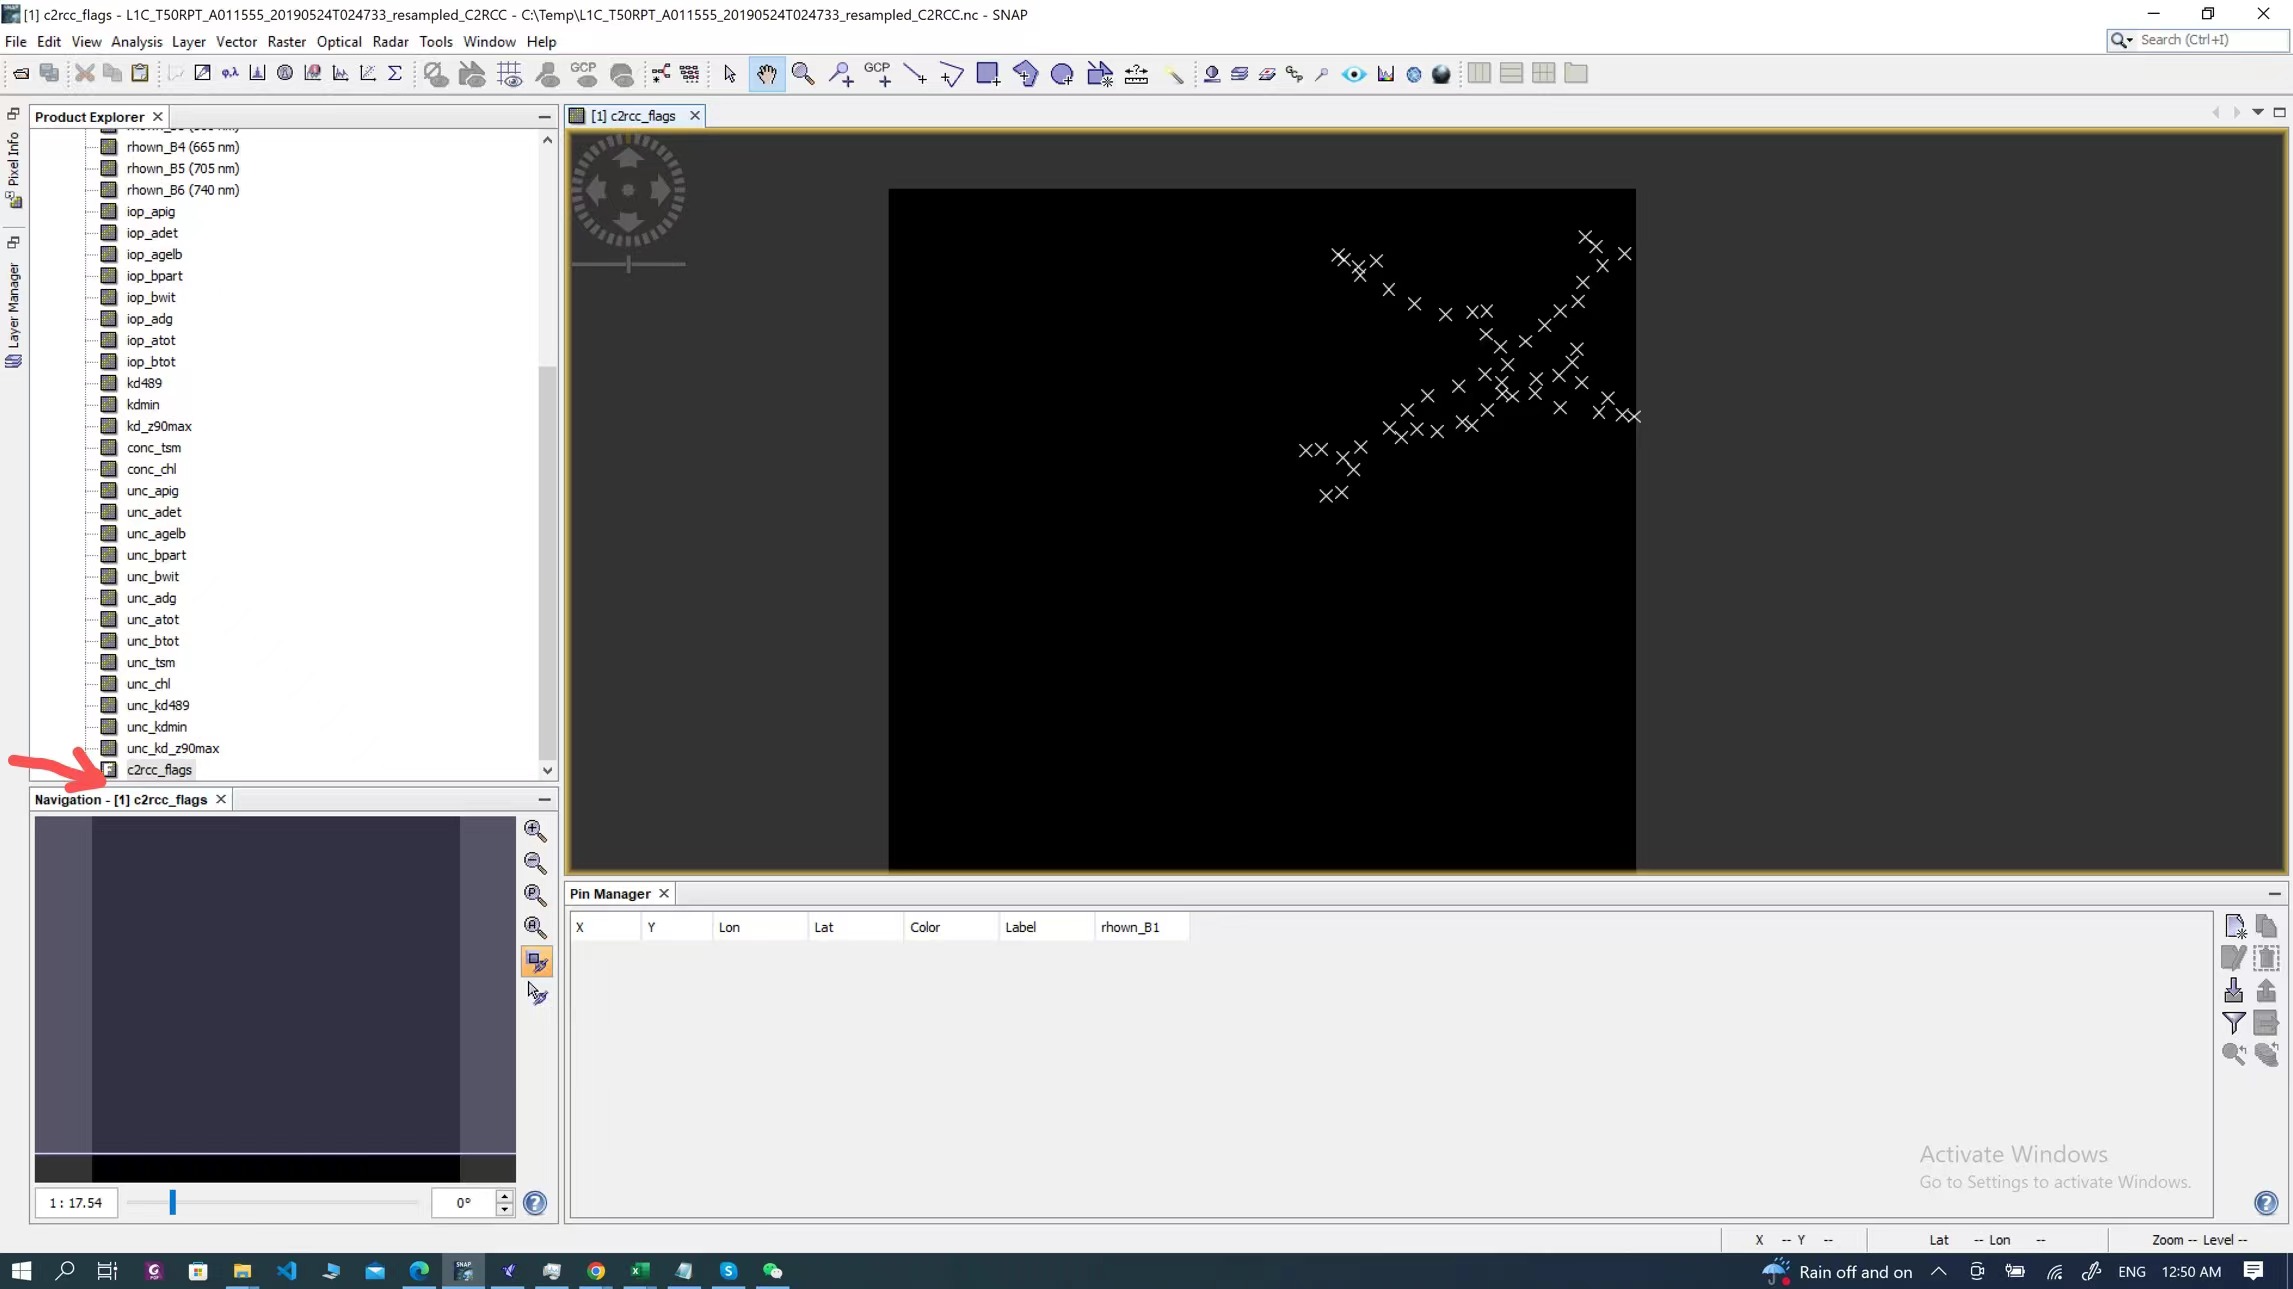
I opened the C2RCC_Flages, Rhown_B1 and added my samples
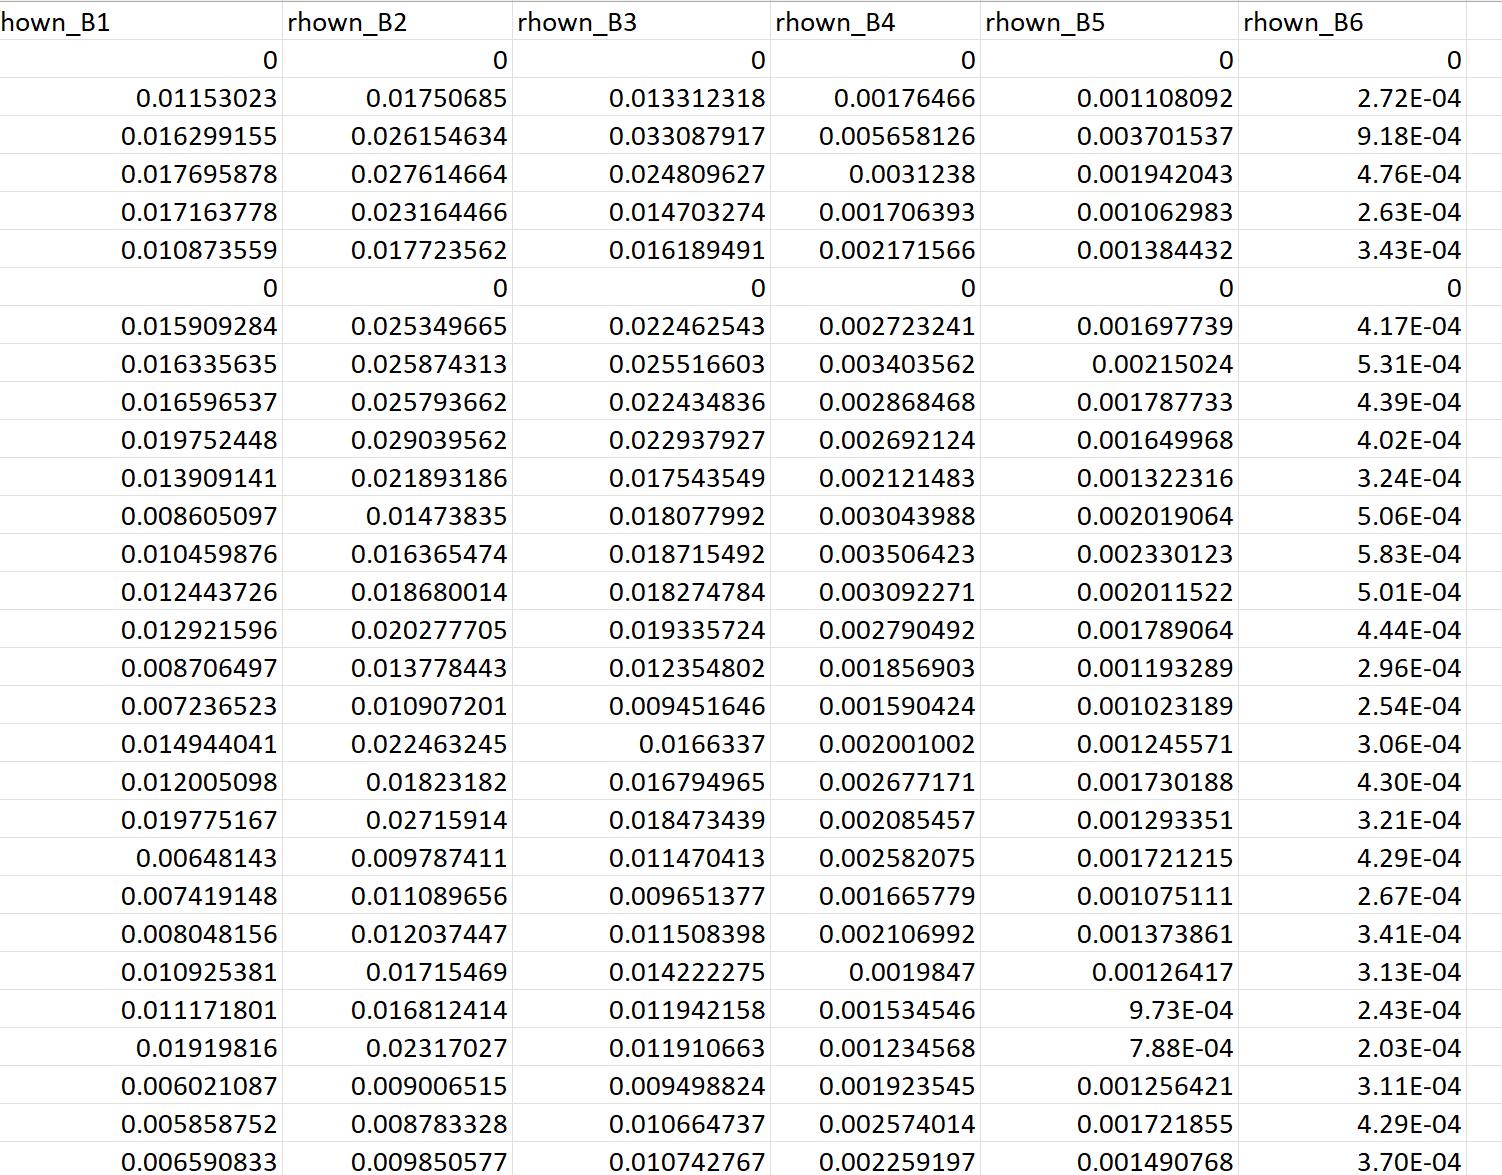
Then I applied Raster- export - masked pixels and export it to excel, but the exported values are not C2RCC-flages, i think it reflectance values.
So how can I export the C2RCC flags at my samples to determine un valid samples and how to exclude the un valid pixels. May be i need to exclude the samples that are located in un valid pixels ?
Thank you so much for all your support.
Mona
You have three options.
One is which I already mentioned. Set the valid-pixel expression for each band in the properties dialog.
Then you can export the data as mask. The locations are still exported but the invalids are indicated as NaN.
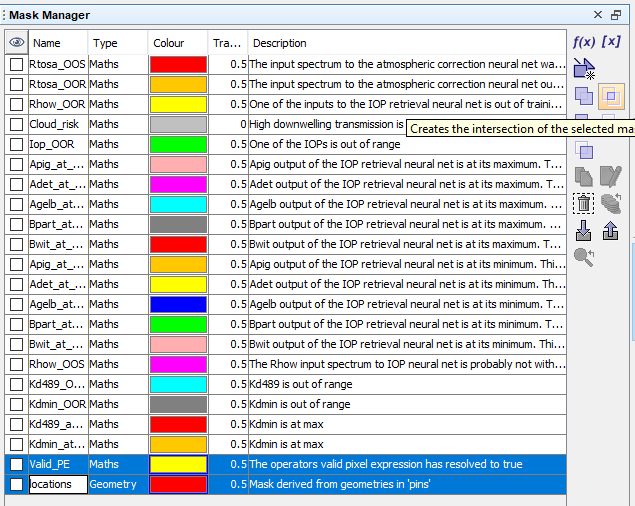
A second option is to intersect the mask of your locations with the mask of the Valid_PE flag in the mask manager.
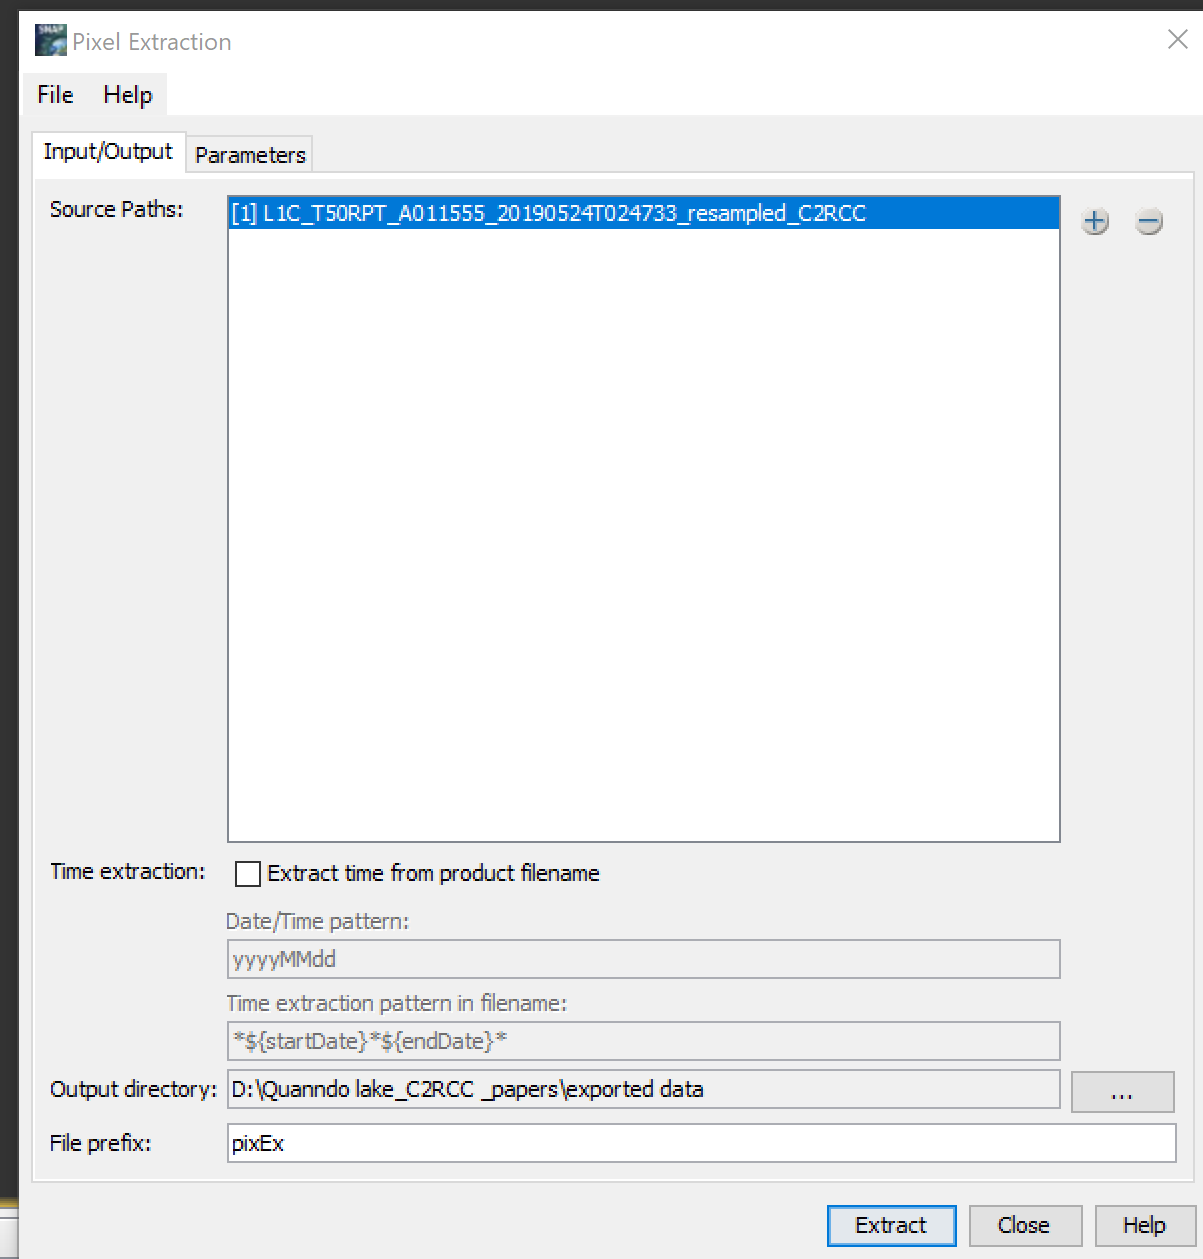
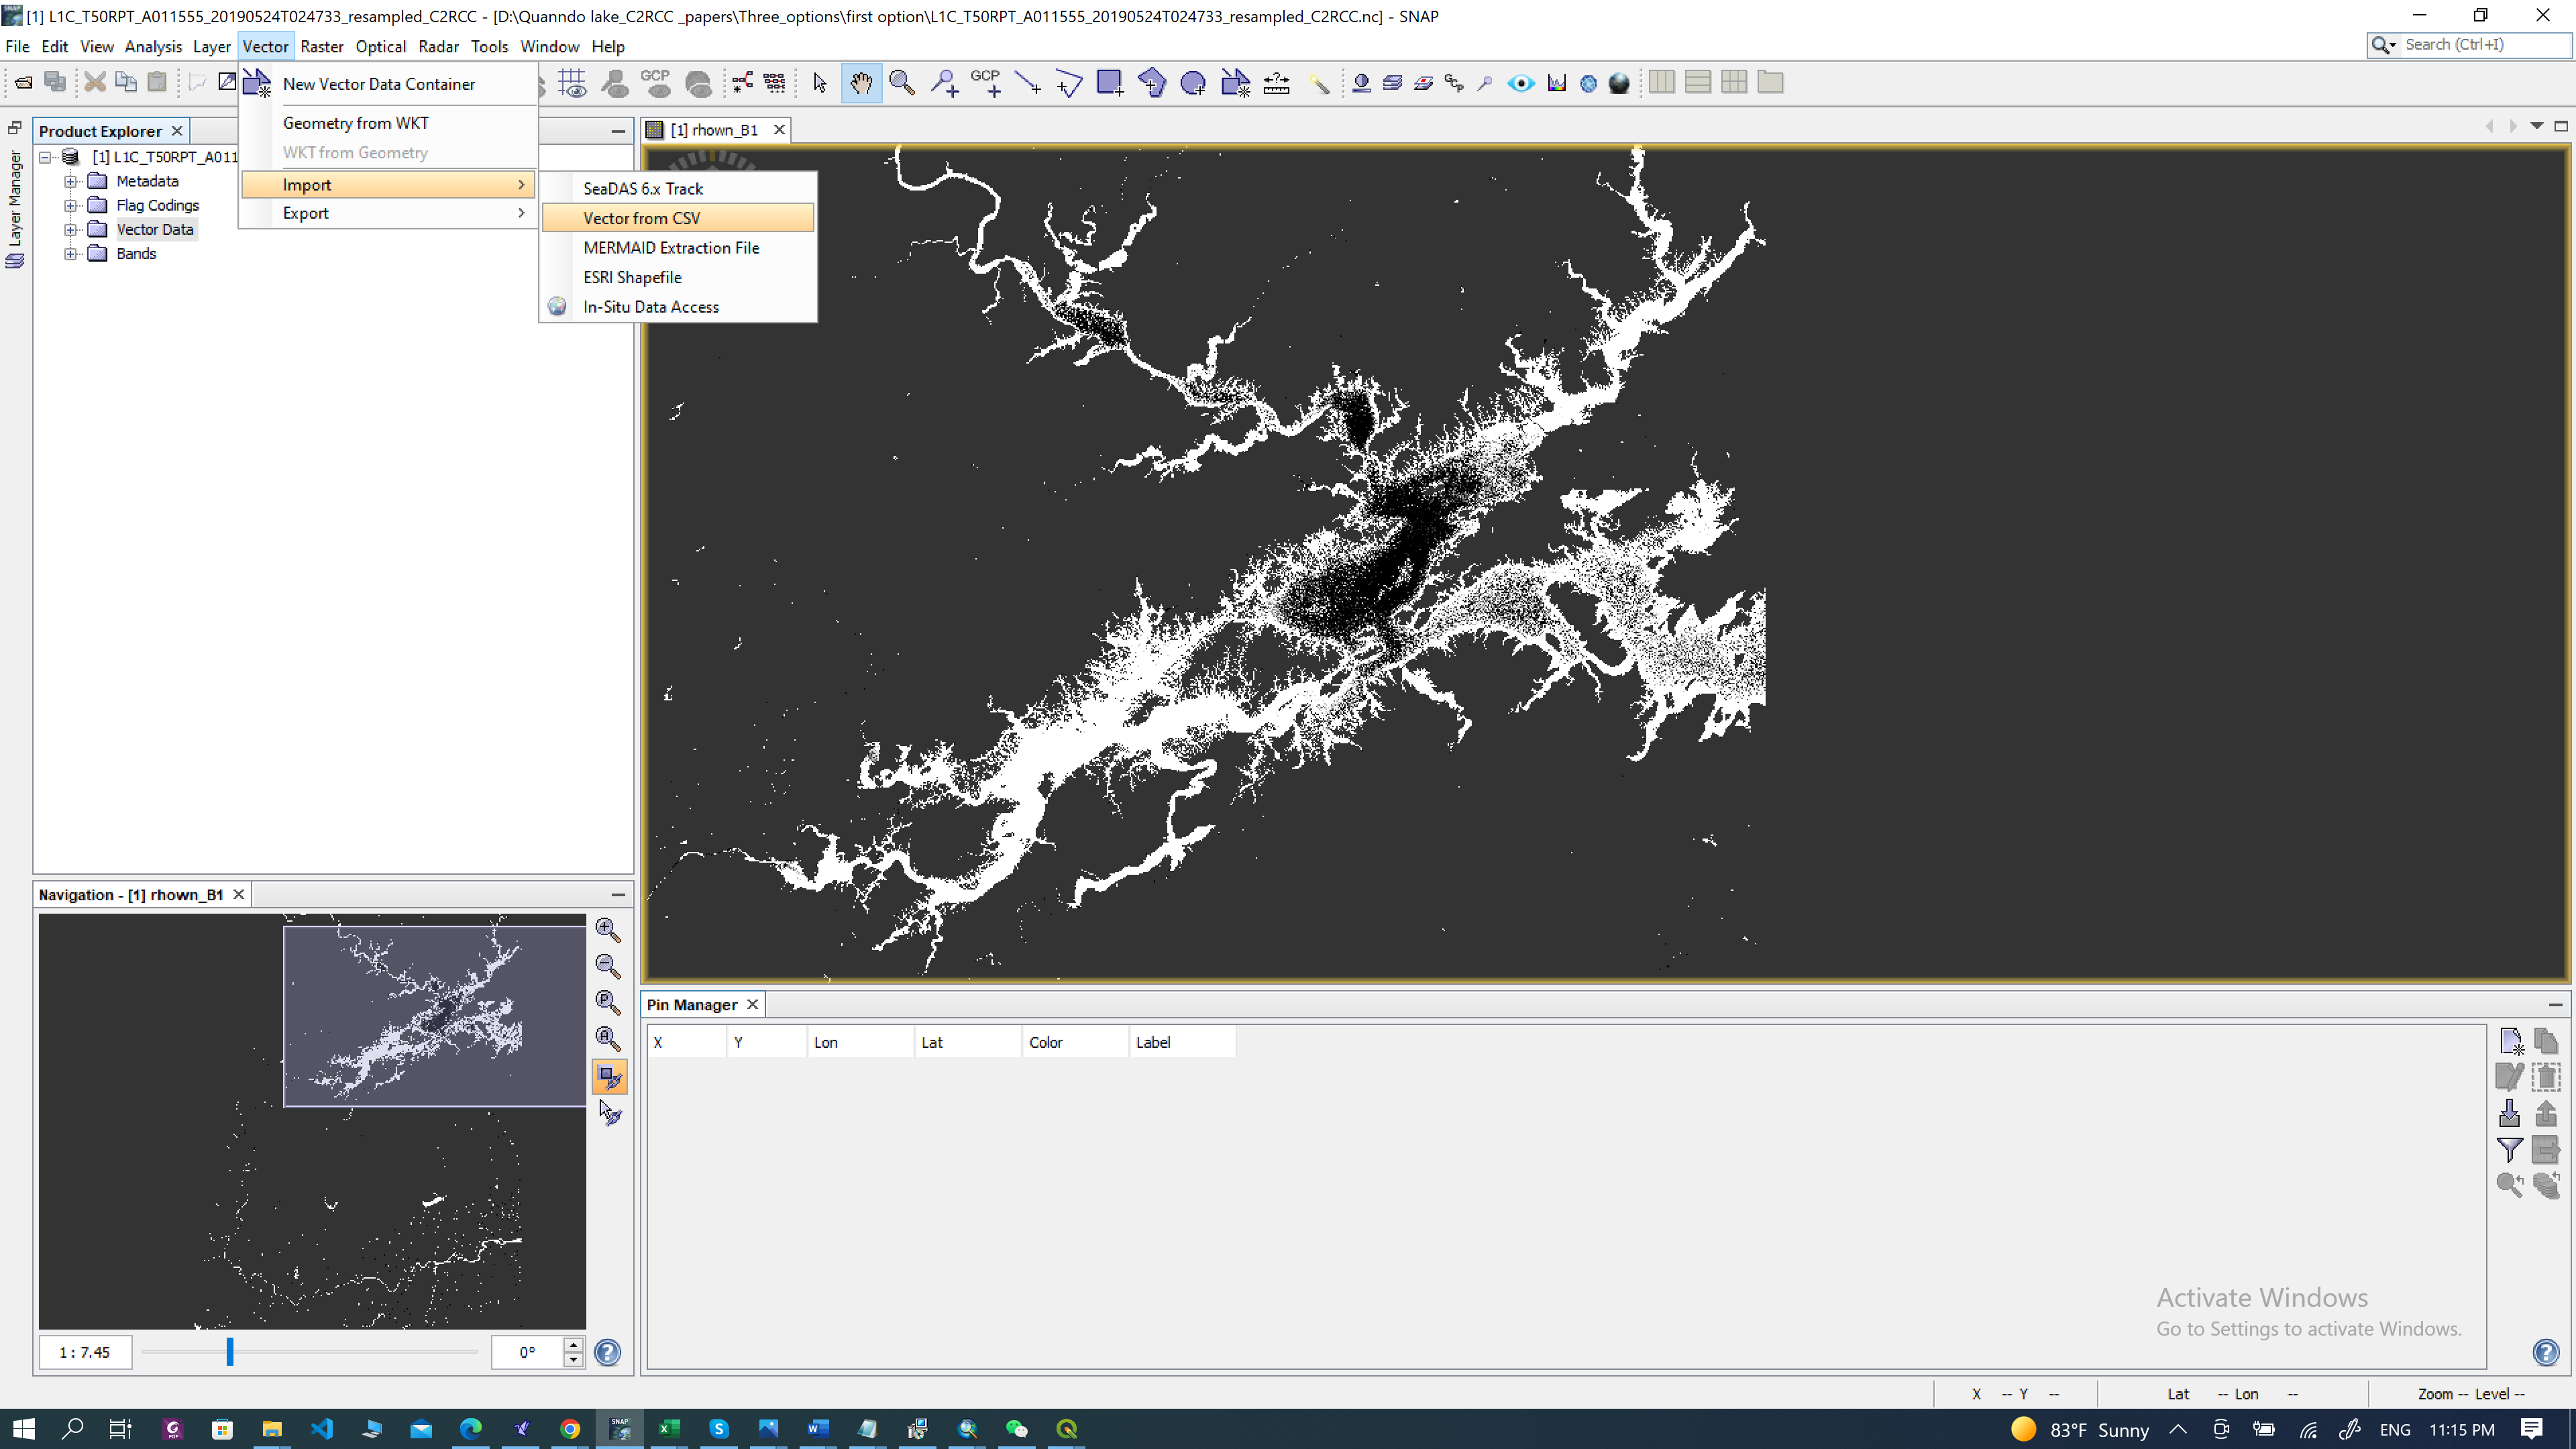
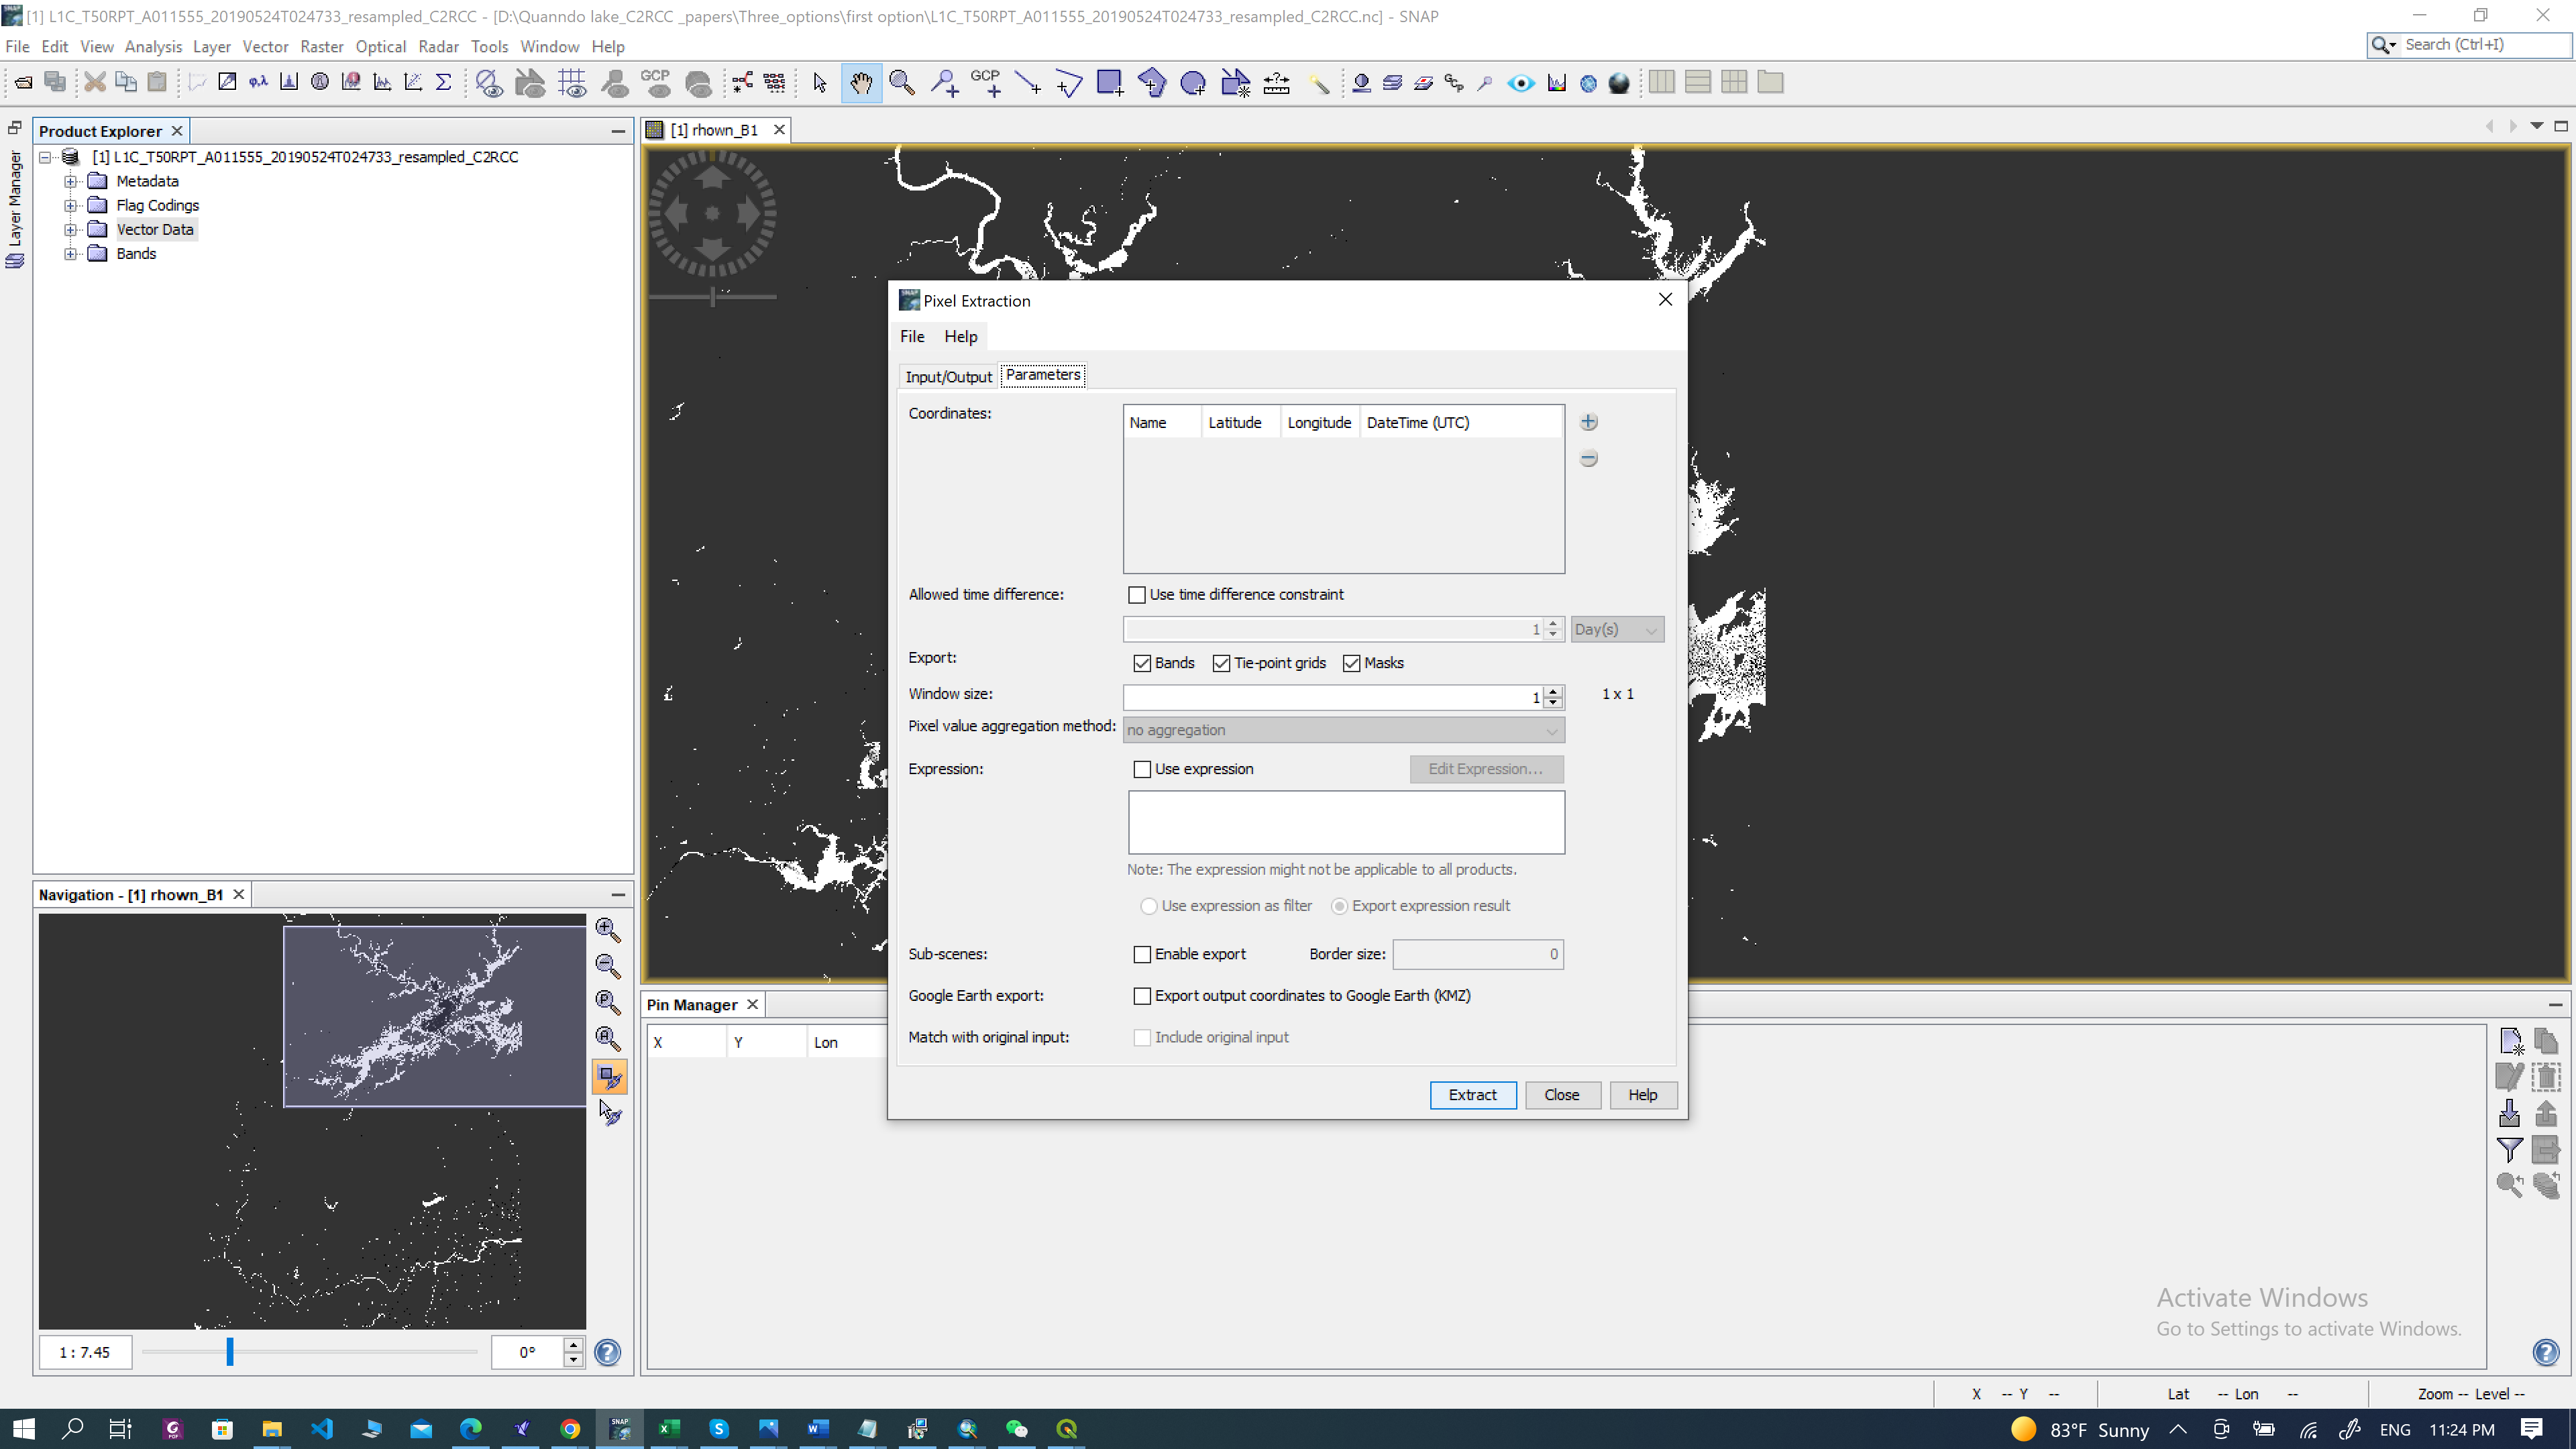
A third option is to use Pixel Extraction.
Probably the second option is the one which works best for you.
Thank you so much marpet, I appreciated that to you. It works very well with me,
just one thing I need to do now, I need to make 33 windows and 11 windows for the C2RCC output before export it.
How to make this step? and this step should to be applied before process C2RCC or after or no matter.
Thank a lot
Mona
This could be done the Pixel Extraction tool there you can define a window size.
This is the easiest way.
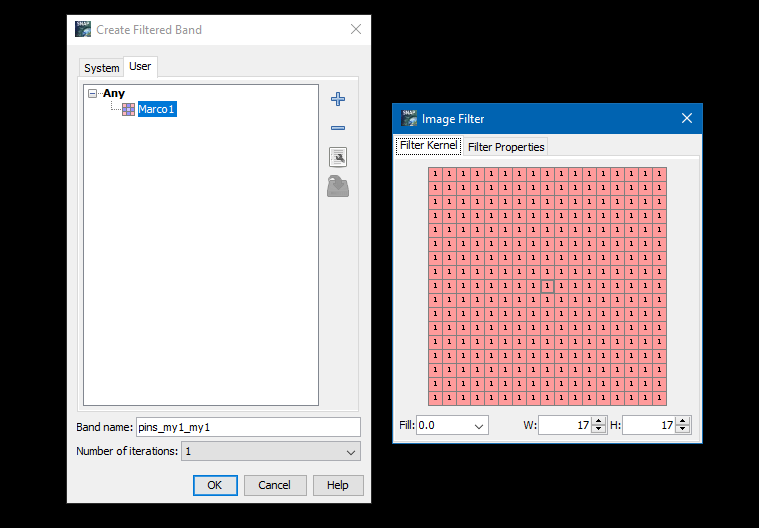
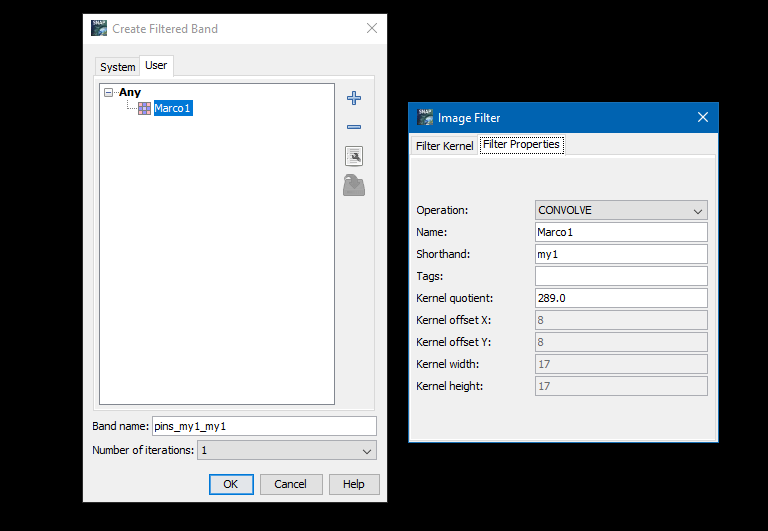
You could also apply a filter (Raster Band) on the mask you have used.
Create a user filter with the appropriate size and use CONVOLVE as operation.
This should be done after C2RCC was used.
Thank you so much marpet for all your efforts and support.
I tried the pixel extraction tool. I imported my data as shapefile to snap. In pixel extraction tool, should I add the data coordinates manually or it could be readied directly. Also in expression: I think this expression no need to be added as i added it to all bands properties before, “c2rcc_flags.Valid_PE” . Last thing is why C2RCC output Rhown are only for the first 6 bands of S2MSI.
Thanks a lot
Mona
The pixel extraction tool does not support shapefiles.
But maybe you can convert the shapefile into a text file?
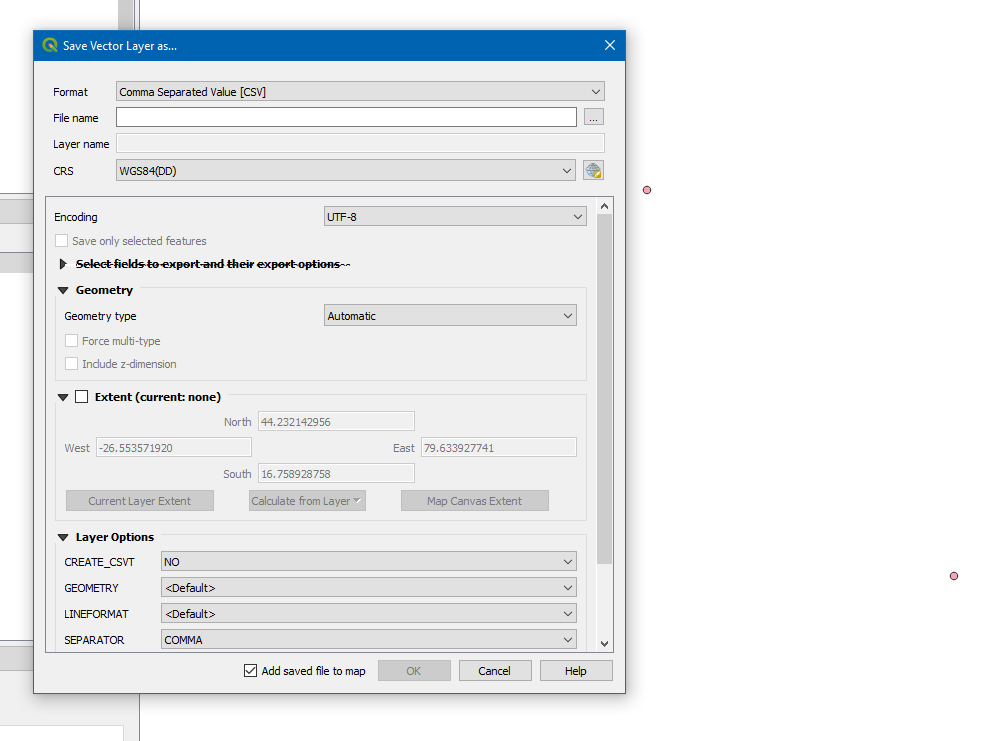
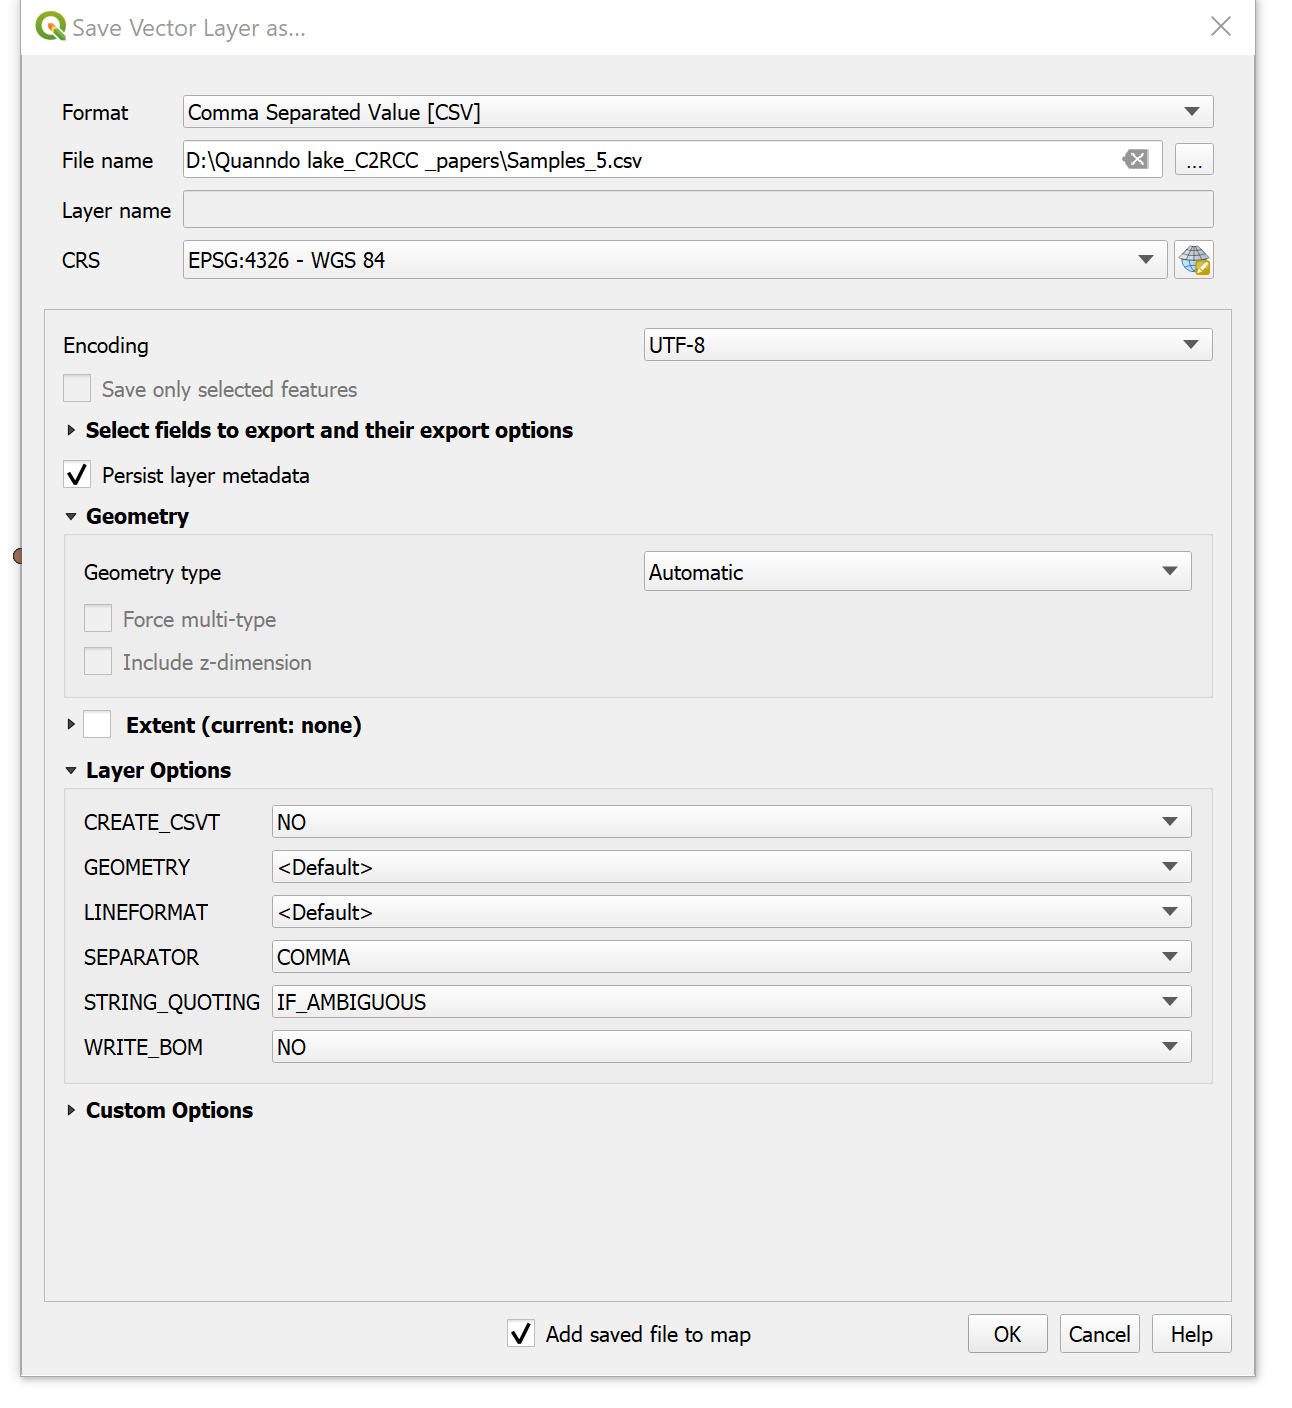
QGIS should be able to do it. Load in the shapefile and export the vector layer into CSV files.
I’m not sure why only 6 rhown bands are provided. Short answer is the neural net is trained like this.
But I’ll ask the scientists and get back to you when I have an answer.
Hello marpet
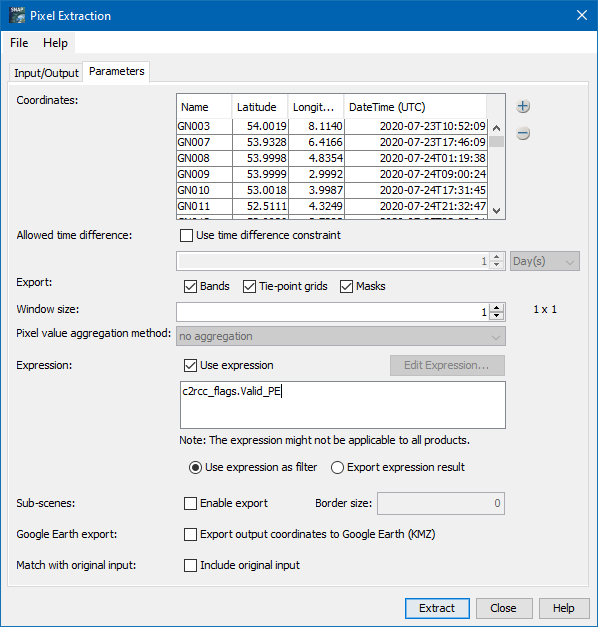
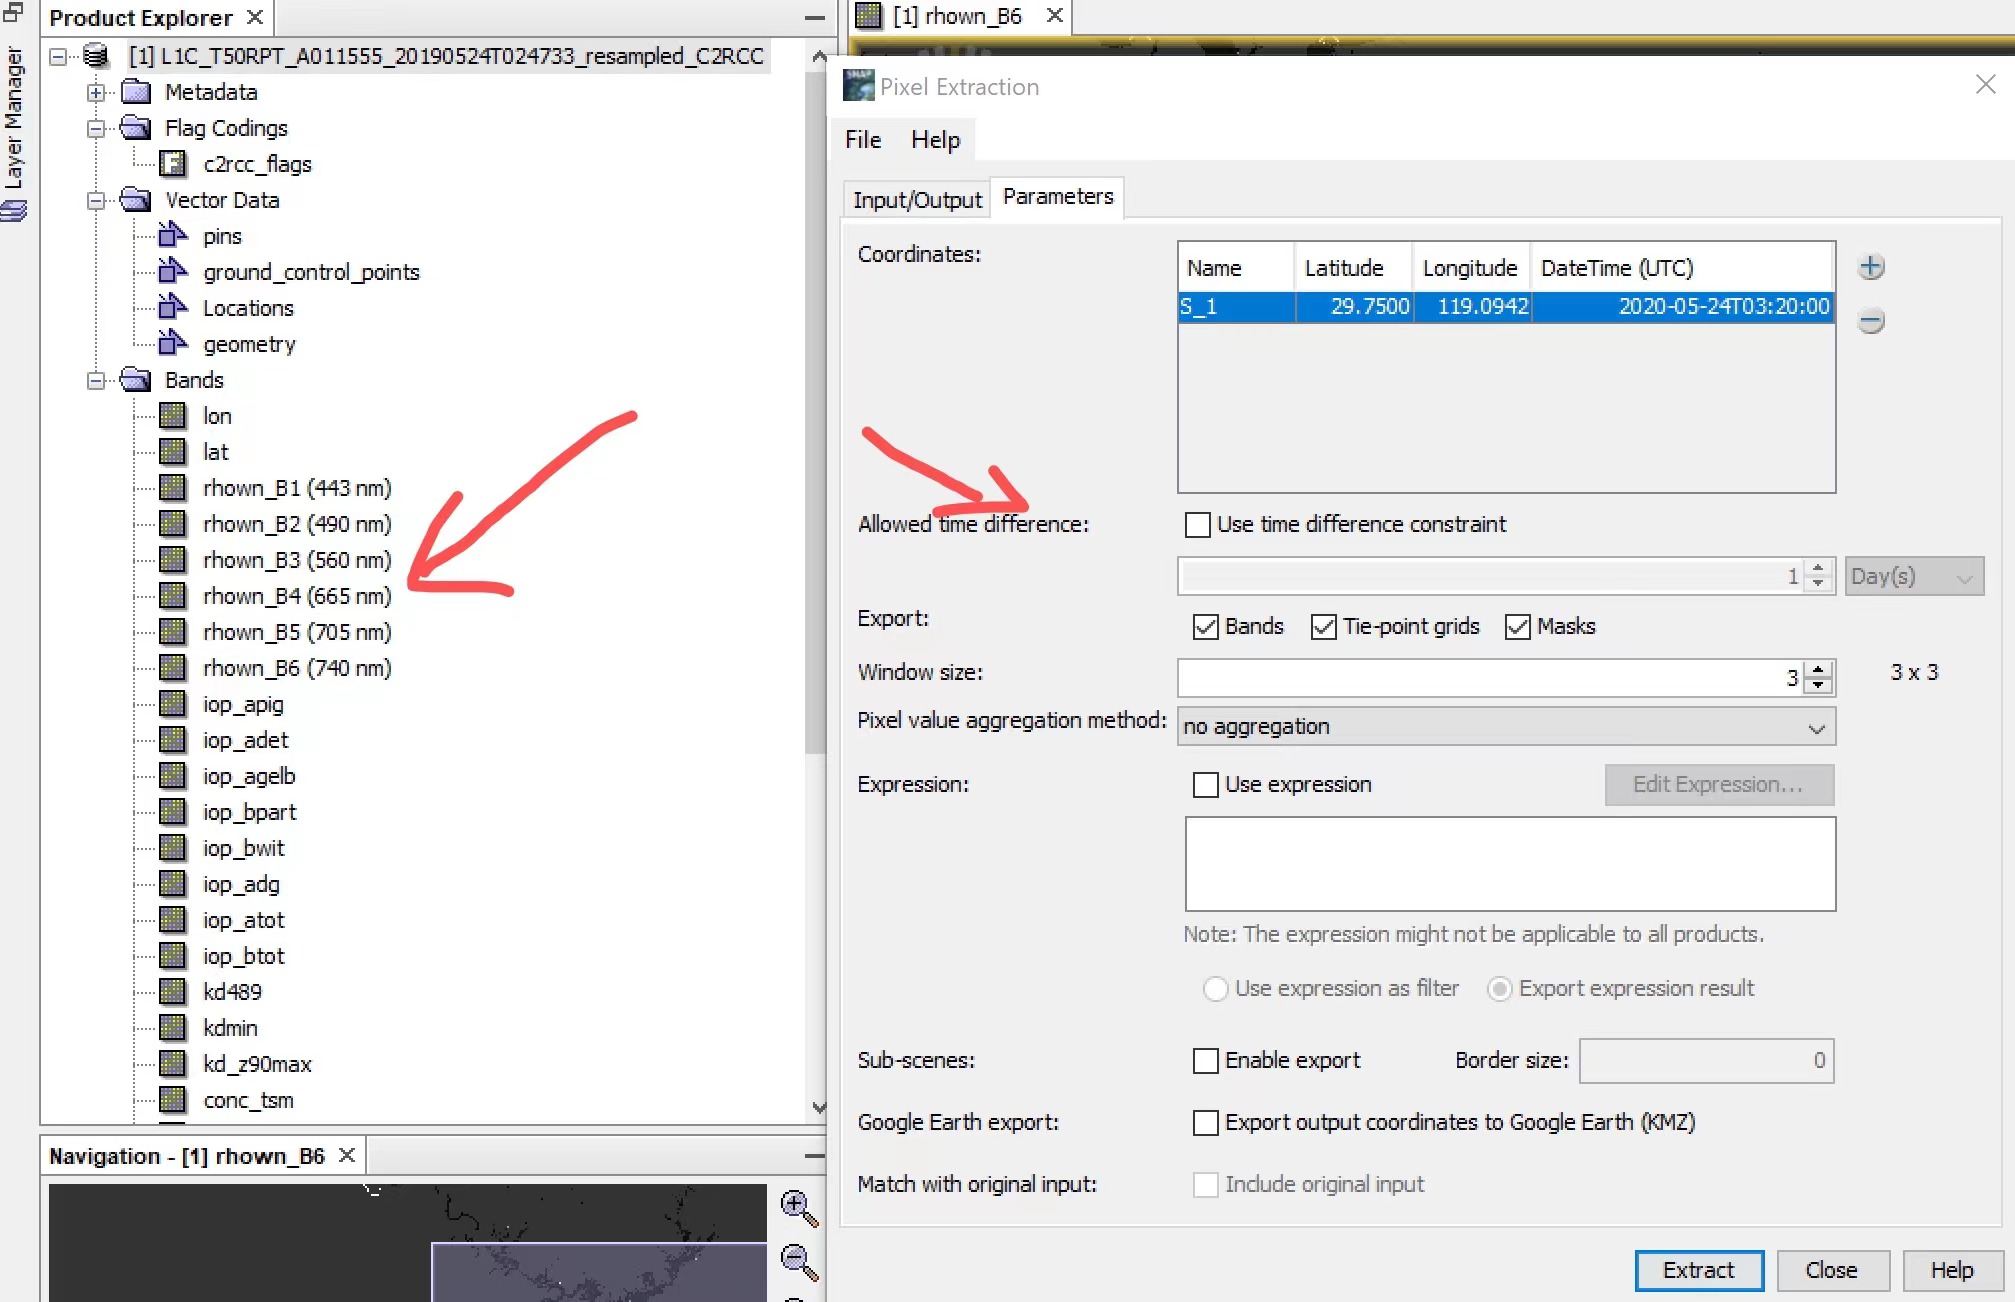
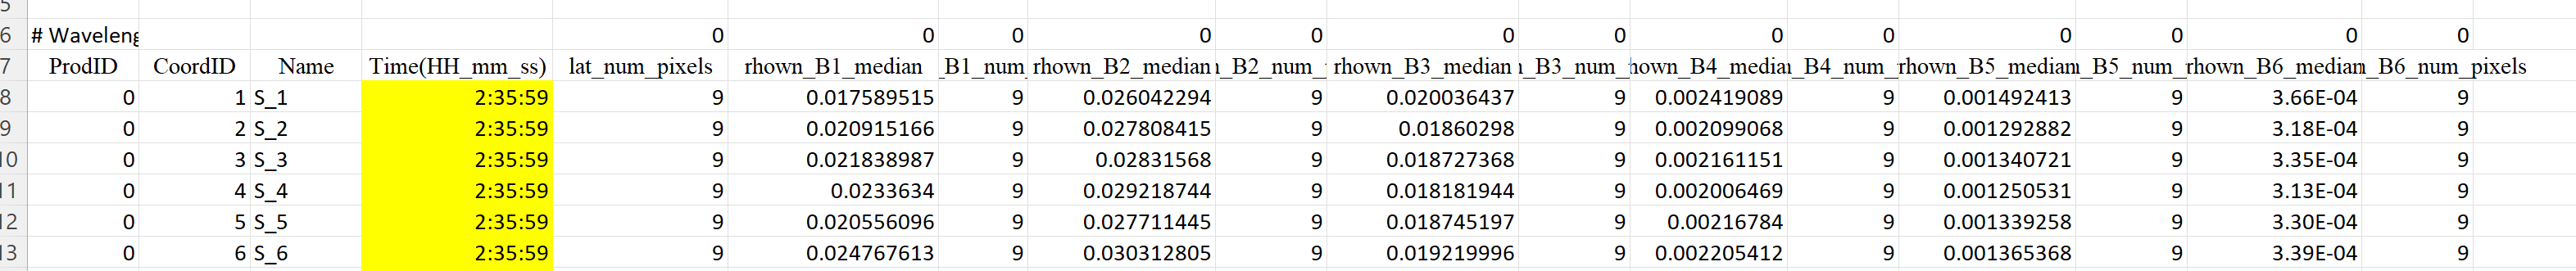
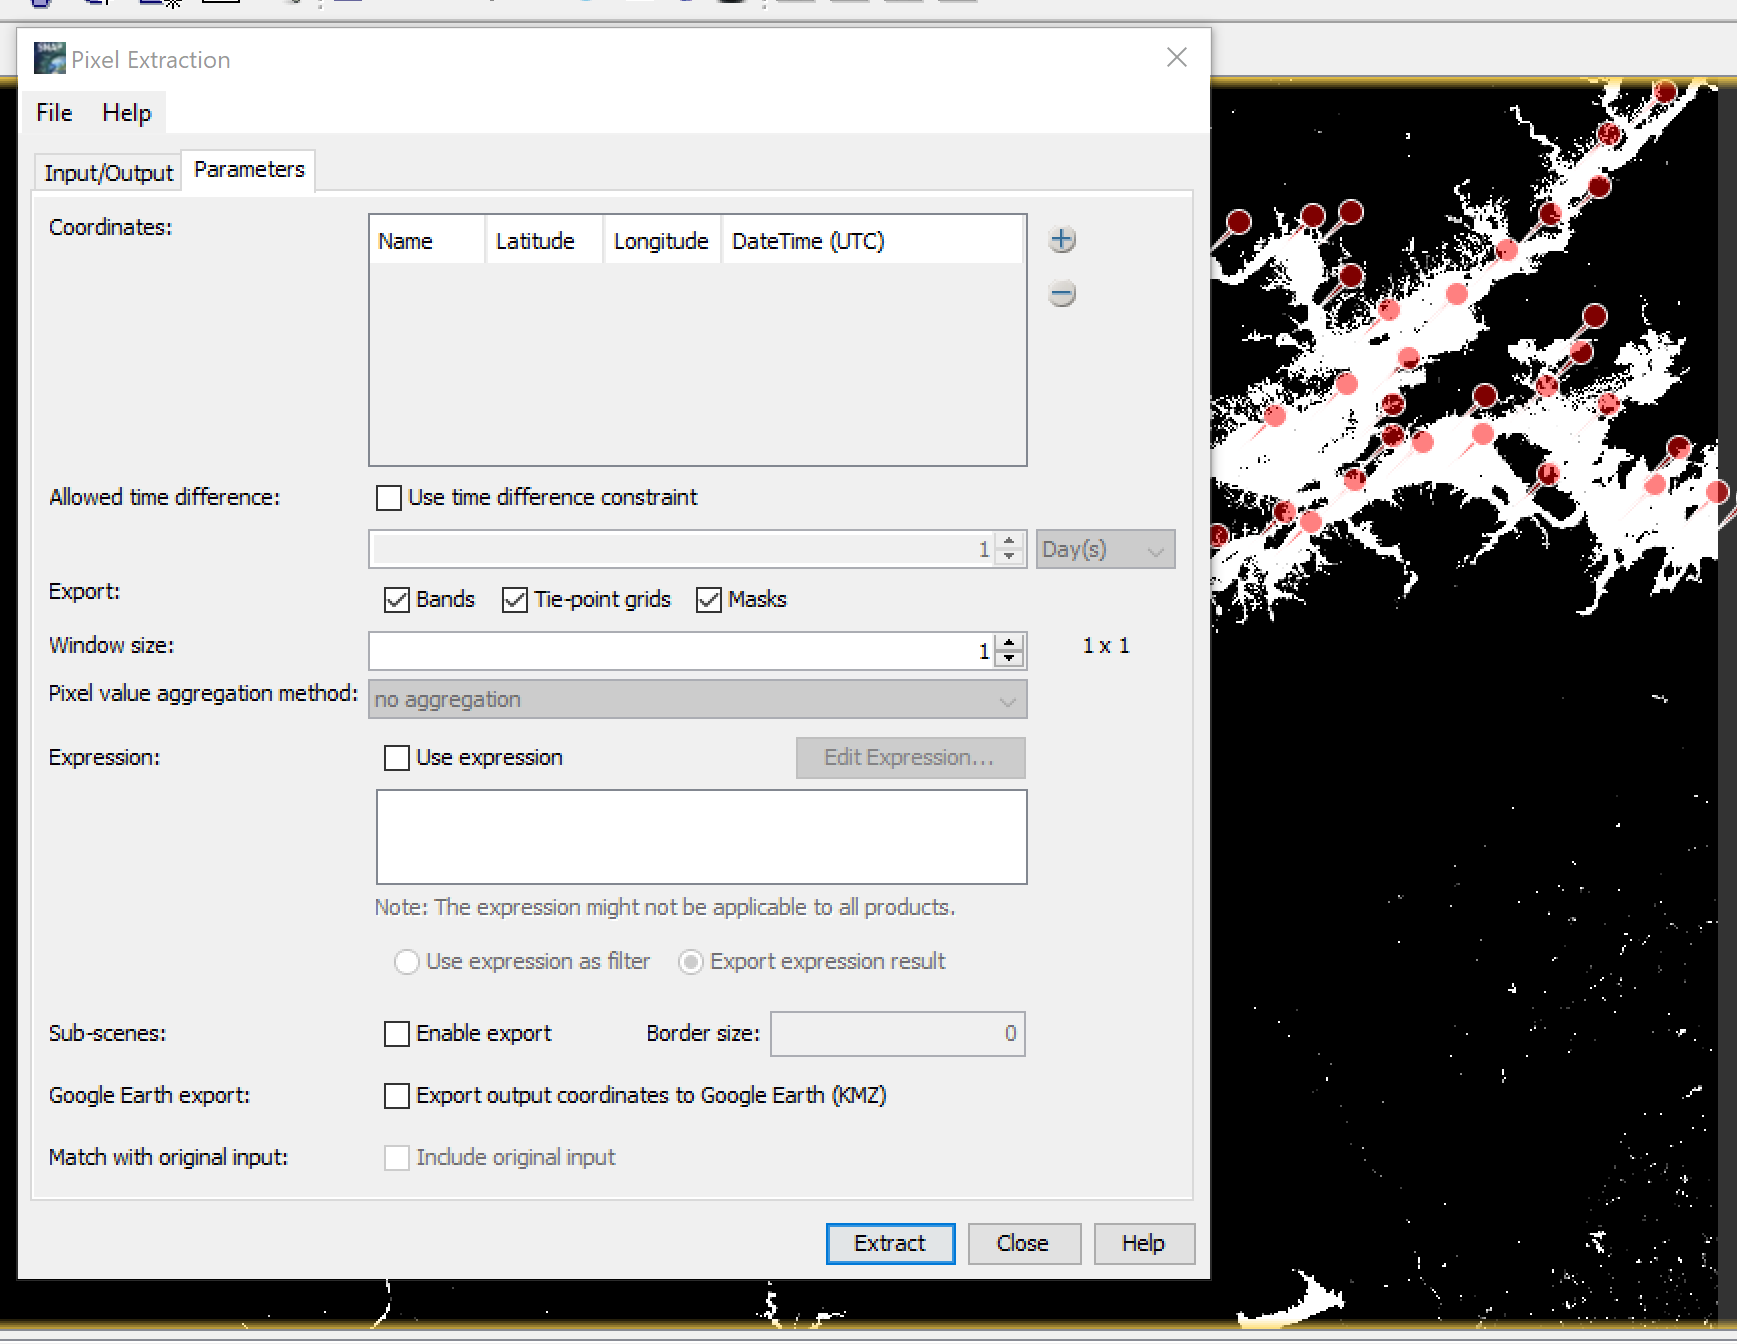
I have added my location manually, changed the sampling time to UTC zone according to the requirements , 3*3 windows and the aggregation method is median.
Here is first 6 results, But i noticed that the time is same for all samples, even the input time is different for each sample.
Can you pls check what the wrong?. I will also try to convert the shapefile and export the vector layer into CSV files in QGIS.
thank you so much
Mona
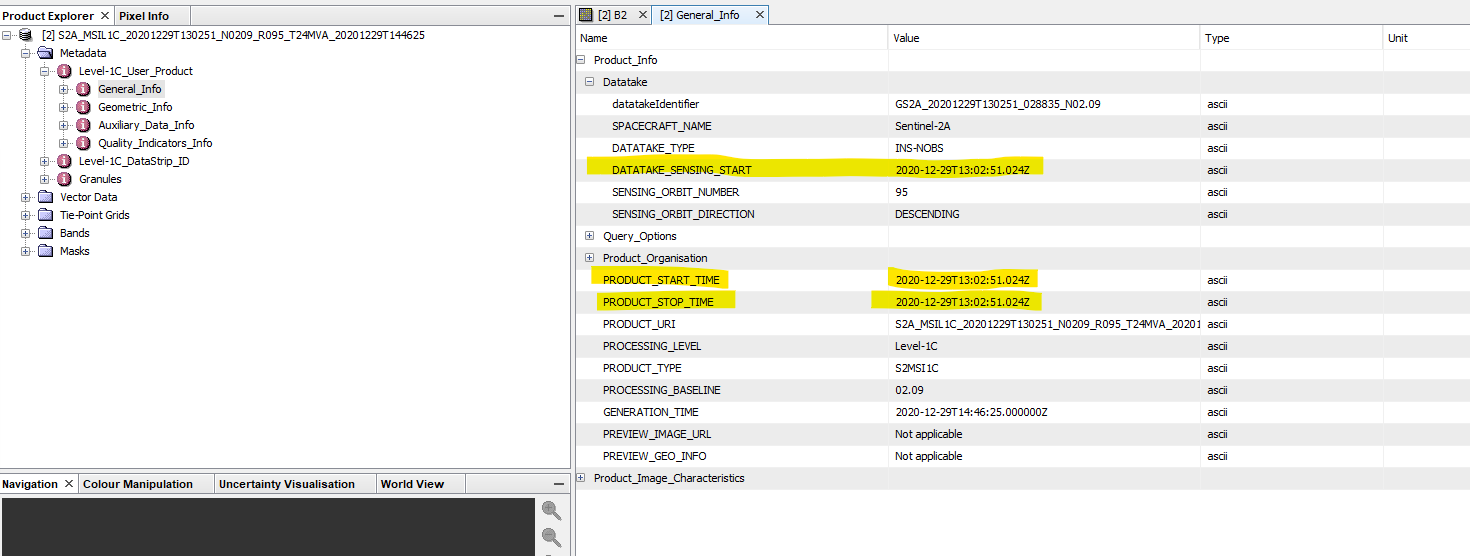
S2-MSI data is taken in one shot. That’s why all pixels have the same time stamp.
You can see this also in the metadata:
Hello Mona,
regarding your question about the missing 2 bands for rhown.
The normalisation is performed with a neural net which is based on a standard water model. This includes the bands 1-6 but not 7 and 8a. We may consider including these bands in a future update of the processor.
Btw. may I mention that recently the ‘C2RCC Community Project’ has been started.
Four different companies steer this project, and it aims to foster community contributions and the further development of the processor. More information at https://c2rcc.org/
Thank you marpet so much for sharing ‘C2RCC Community Project’, i think it will be help a lot
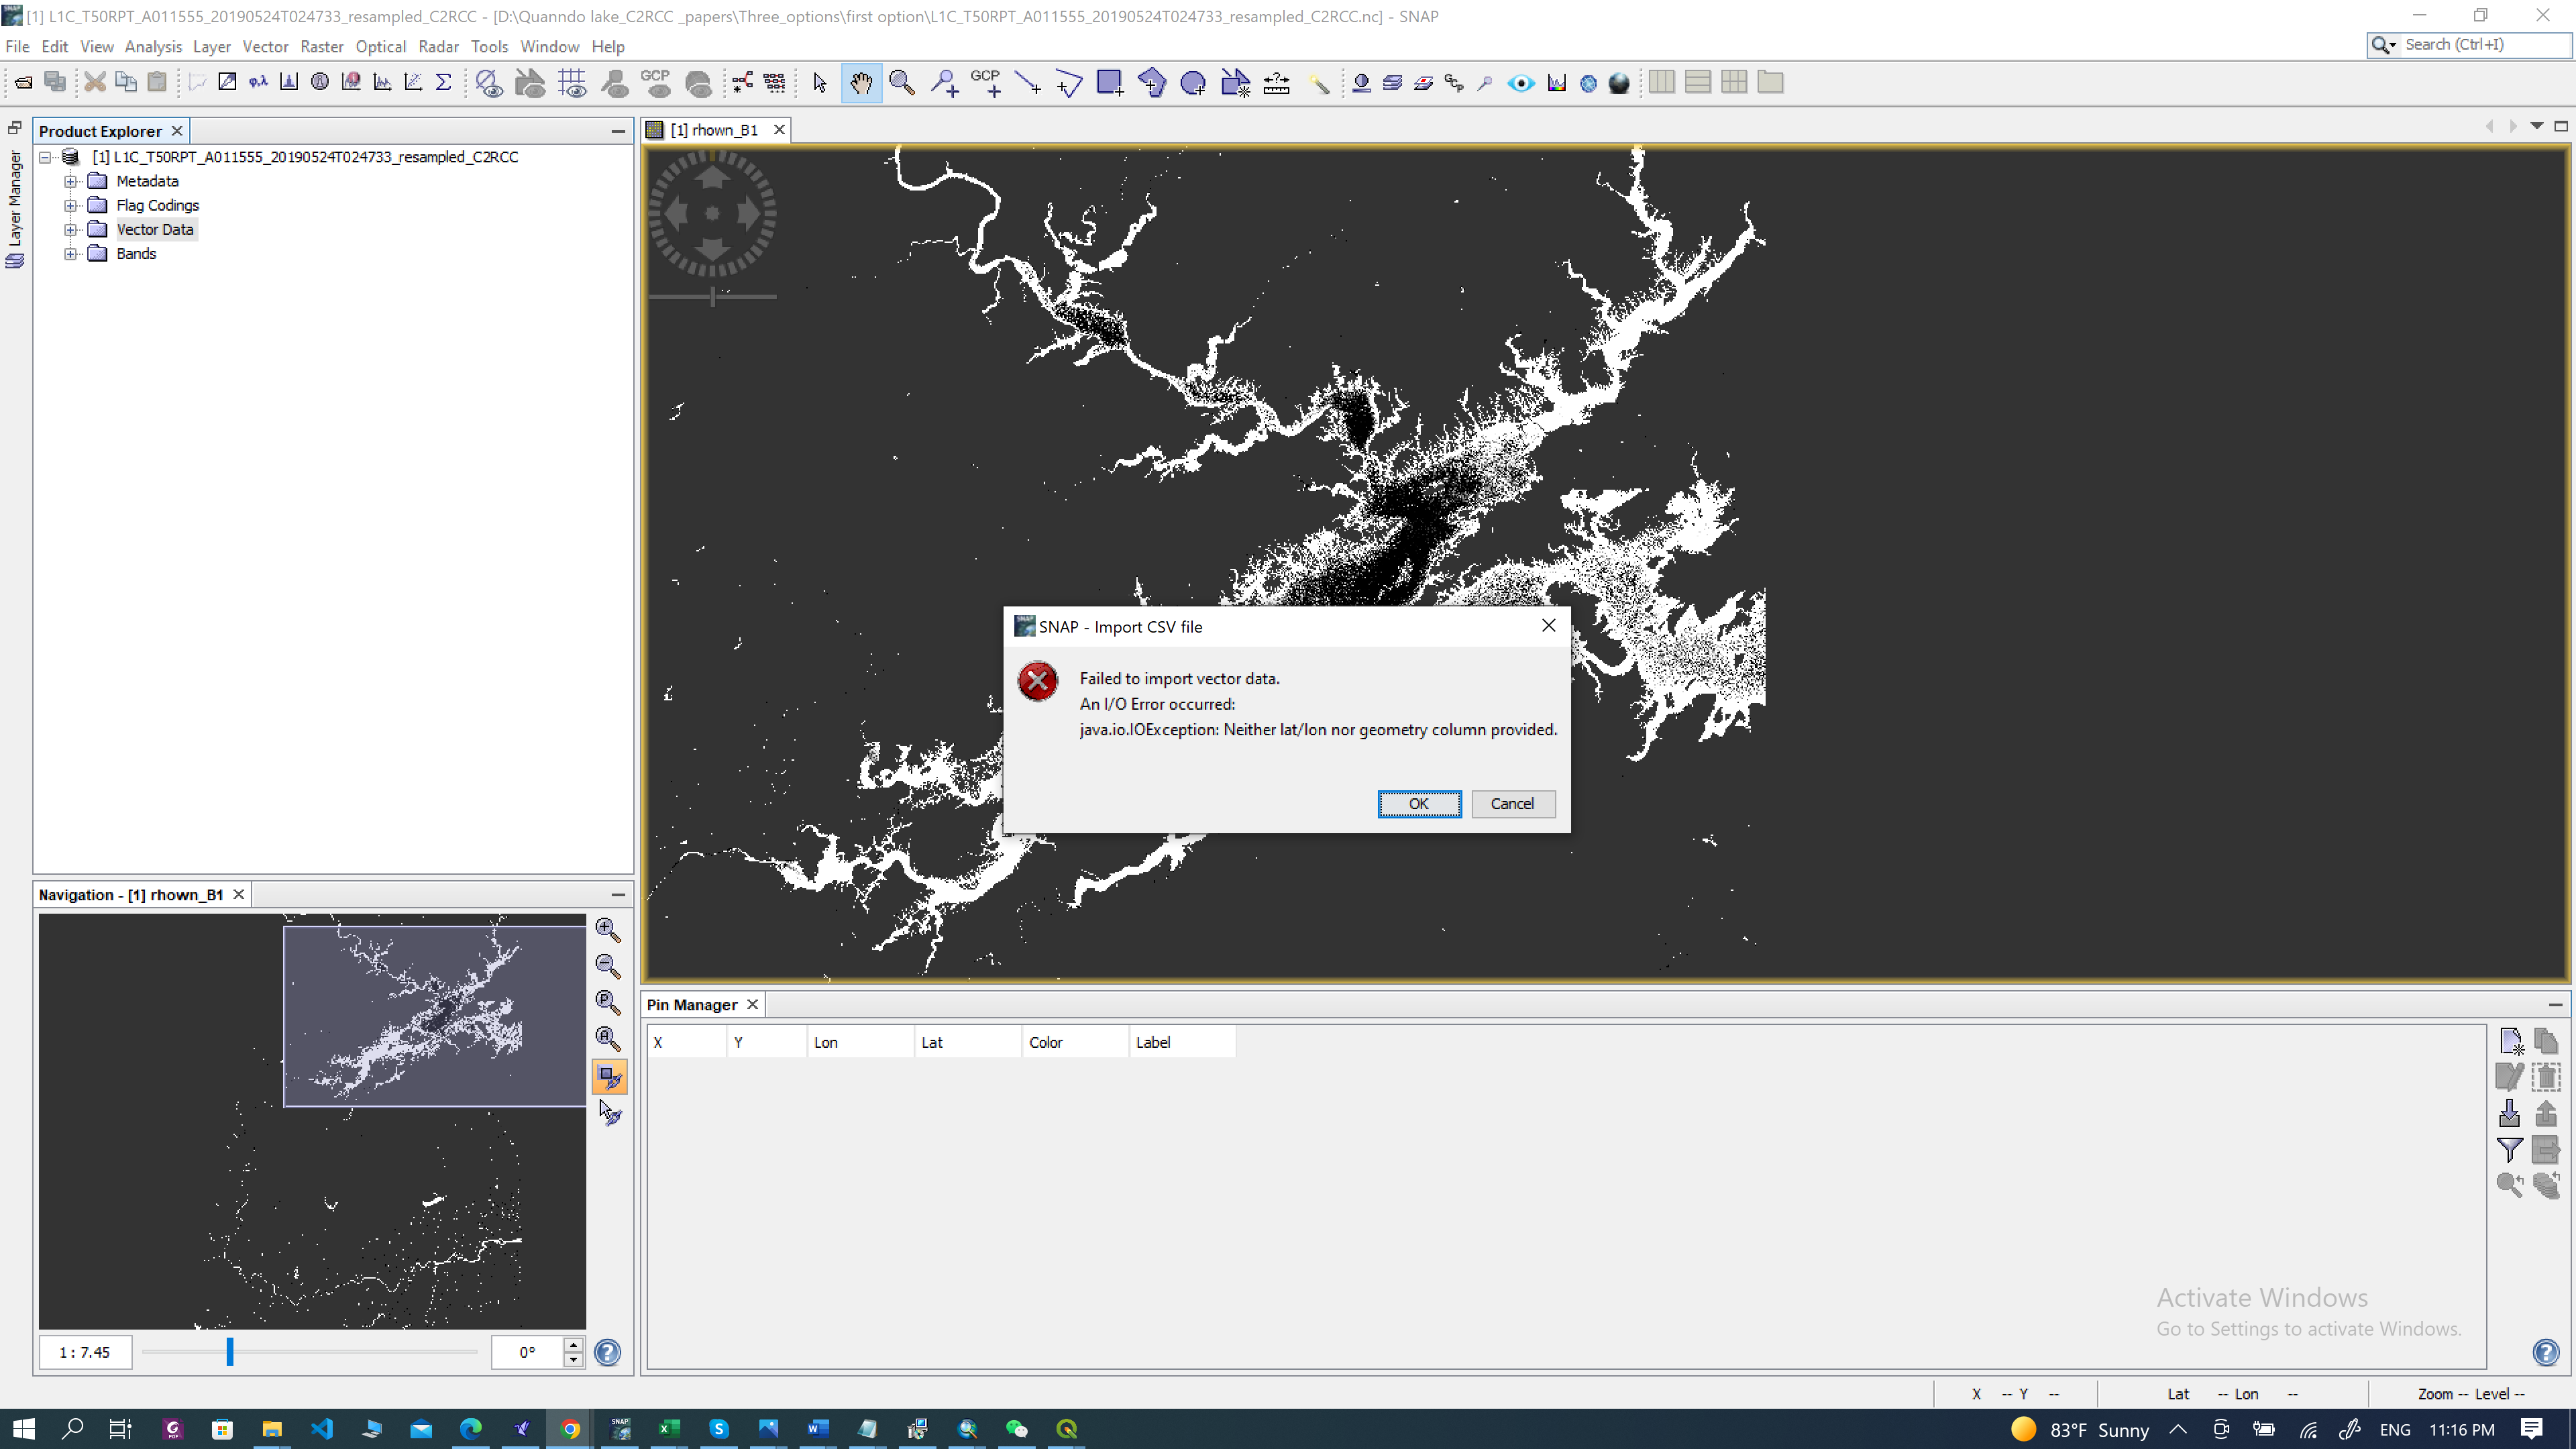
I tried your recommendation and opened the data shapefile in QGIS then i saved it as CSV.
But i got this msg when i open it in Snap.
Uploading: 9350279bcb2782f0ee8b2714a5d6eb9.png…
Another thing after import data shapefile, how can i add display the label, delete or colour it ?
Last thing how pixel extraction tool can read CSV file as i did not find any tap for that?
Thank you so much
Mona
Sorry, I haven’t checked the output of CSV conversion. It seems it doesn’t write coordinates by default. I just expected it.
Maybe QGIS can be configured in a way to do it. But can’t tell I don’t know it good enough.
Another option to convert the point is Online GIS/CAD Data Converter | SHP, KML, KMZ, TAB, CSV, … (mygeodata.cloud)
With this text file it should be easy to bring it into the right format shown in the help (e.g. using Excel).
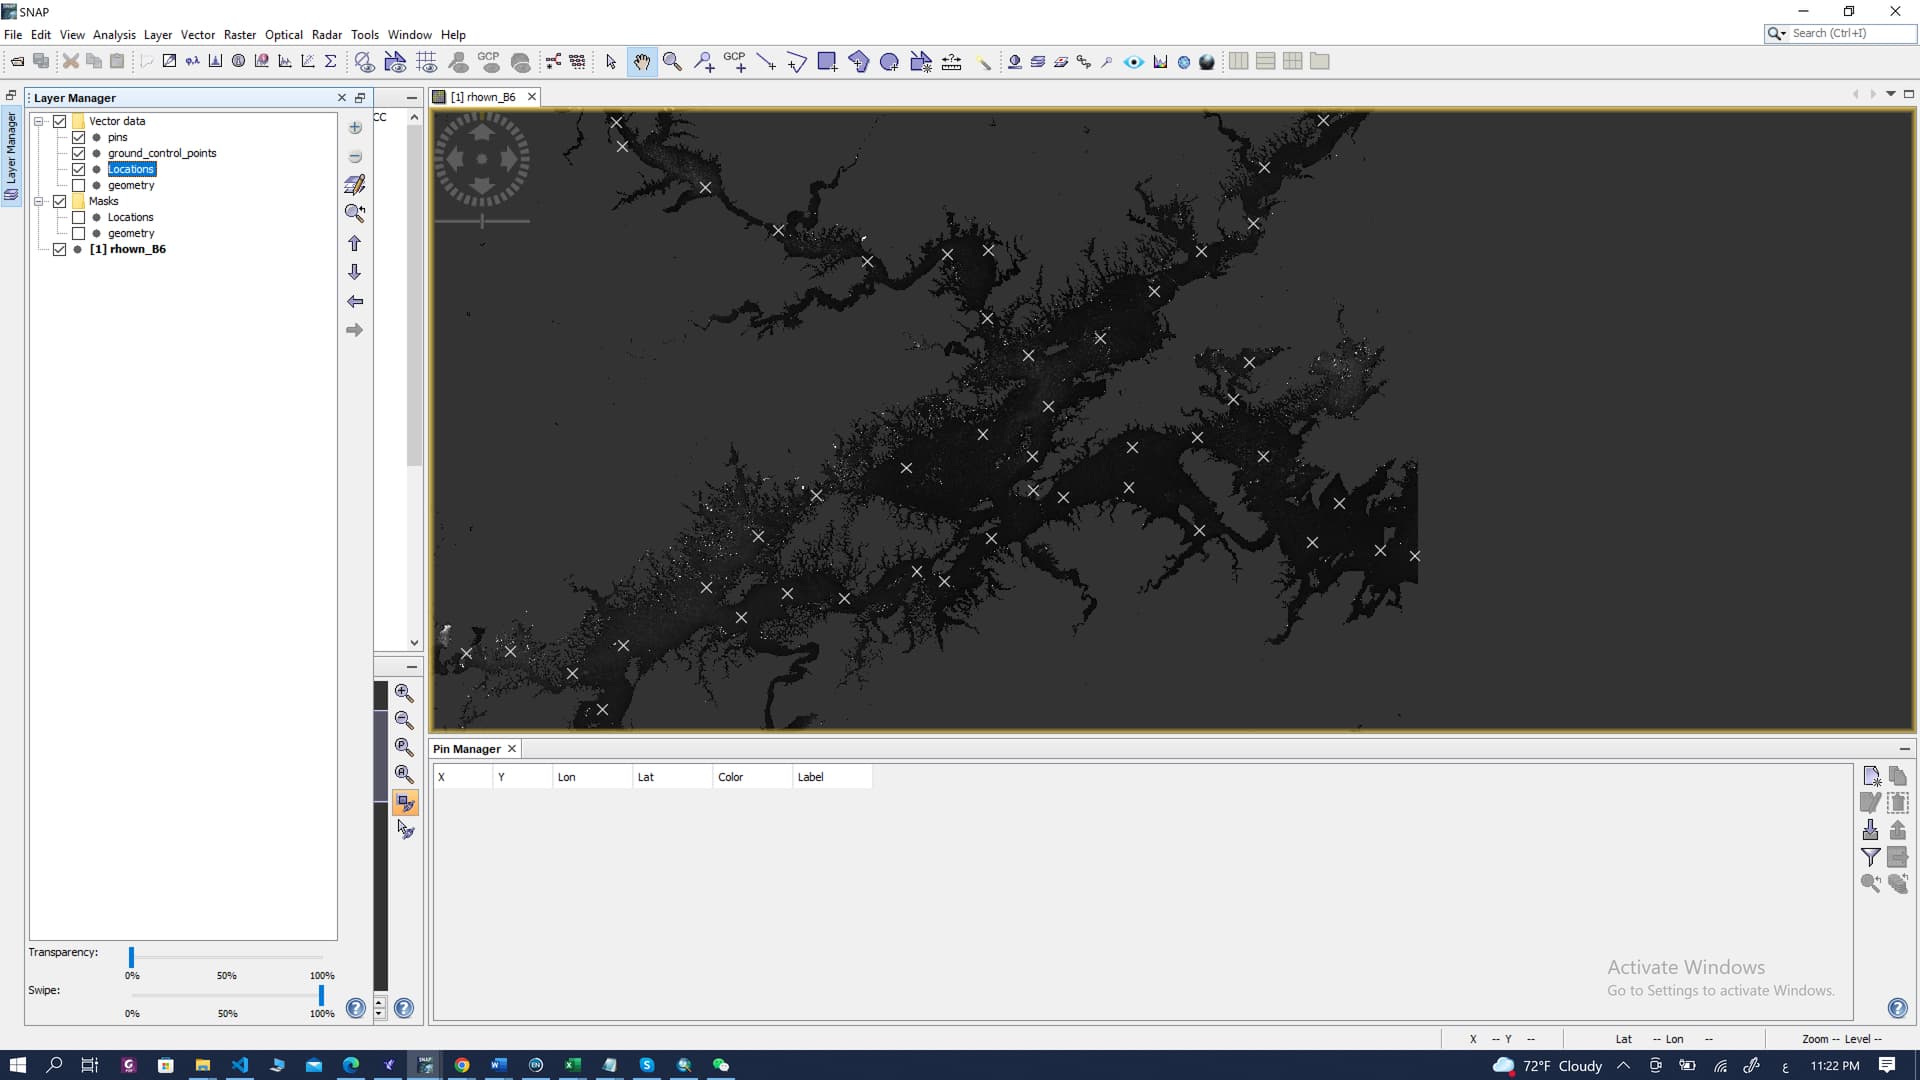
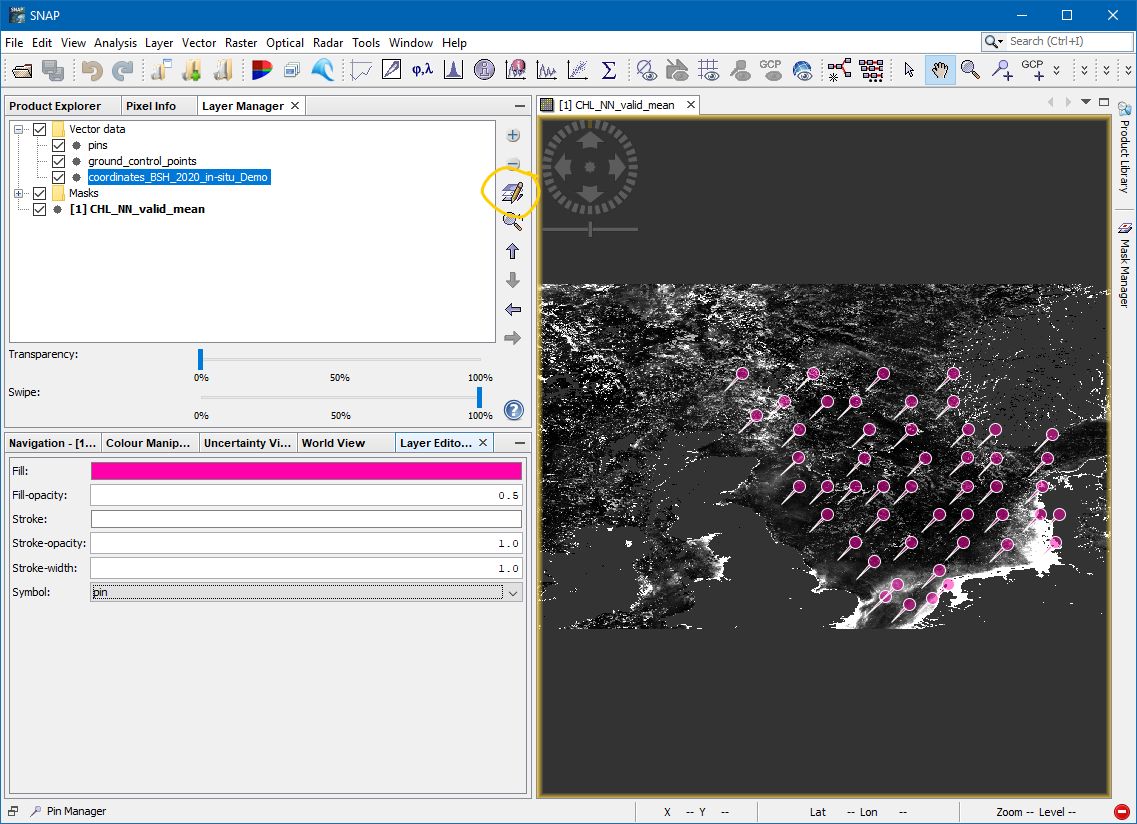
Regarding of the styling of the imported points:
You can open the Layer Manager, select the layer which contains your points and the click on the edit button. This will bring up the layer editor in which you can change some of the styling properties.
Thank you marpet
My data is in excel, CSV, shapfile and Kml.
My problem is how to make pixel extract tools read my data automatically instead of enter the locations manually one by one.
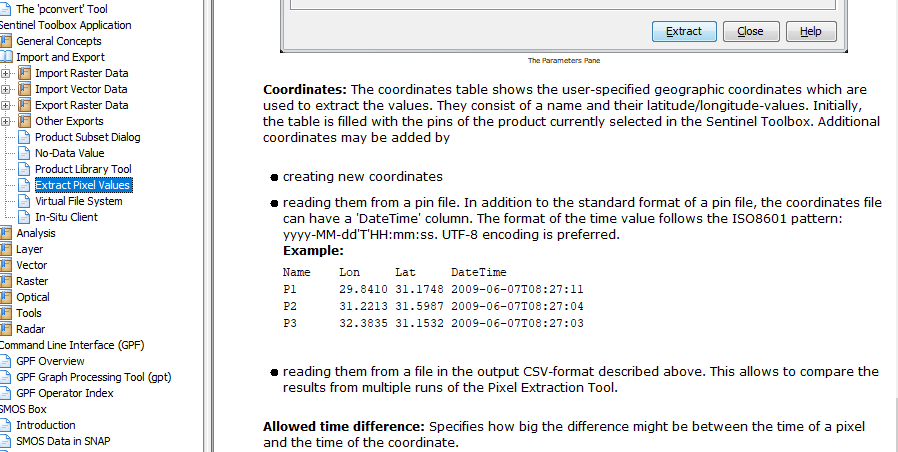
According to the help,
Thank you so much
Mona
The CSV file should be formatted like this:
Name	Lon	Lat	DateTime
P1	29.8410	31.1748	2009-06-07T08:27:11
P2	31.2213	31.5987	2009-06-07T08:27:04
P3	32.3835	31.1532	2009-06-07T08:27:03
But you can also leave out the DateTime colum. Colums should be separated by tab.
You could start by setting a pin exporting it. This will give you an example
Hello marpet
Thank you so much for your support and patient. It works well with me.
Mona