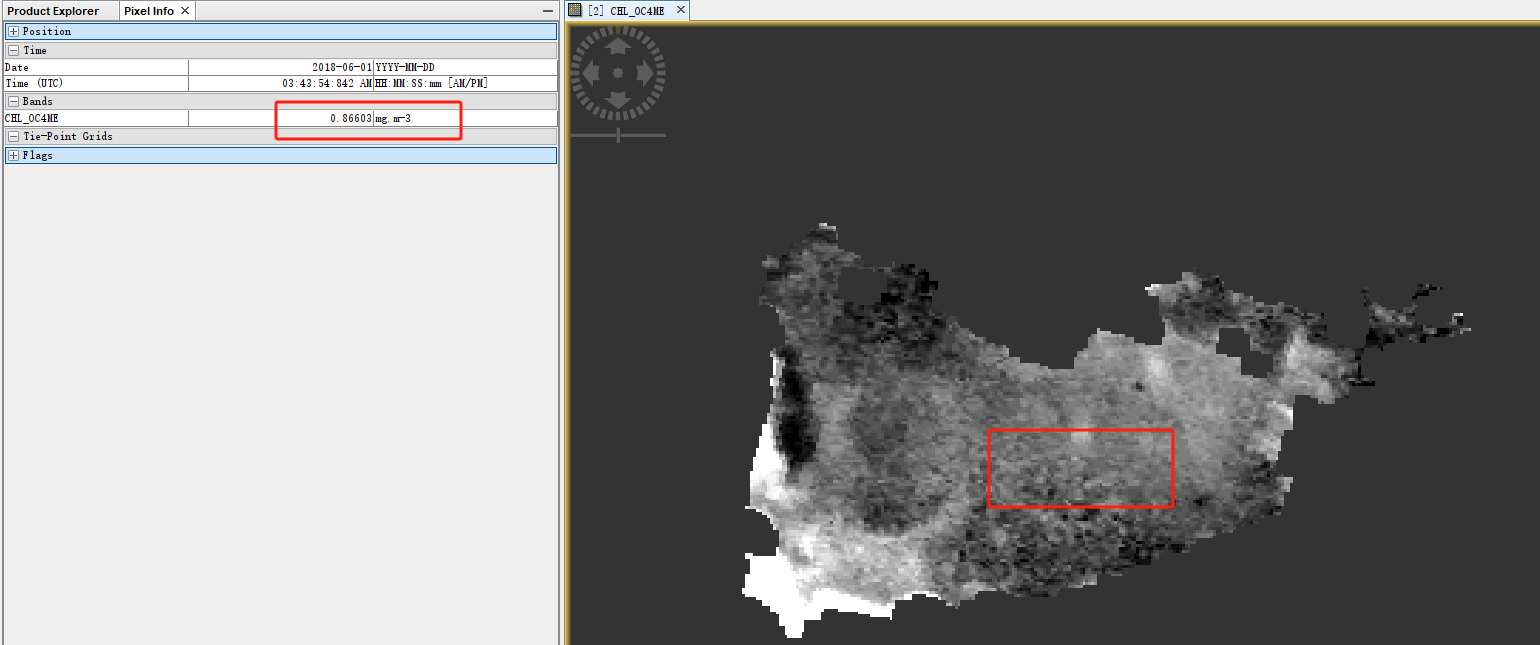
Hi everyone,
I’ve encountered an issue while processing Sentinel-3 OLCI Level 2 WFR data. After performing the “Read-Reproject-Subset-Resample-Write” sequence in SNAP and saving the TIFF, the CHL_OC4ME values read within SNAP are around 0.8, which is normal when compared to the ground truth. However, when this TIFF file is read by Python, ArcGIS, or ENVI, the values appear as negative. This is quite puzzling for me. Has SNAP applied any specific transformation to the OLCI Level 2 WFR imagery? Is it in log scale, perhaps? I would appreciate any insights or guidance on this matter. SNAP:
You can see discrepancies between values shown in SNAP and the values exported to TIFF files because SNAP exports only the raw values without the scaling.
A workaround is described here:
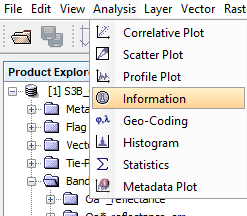
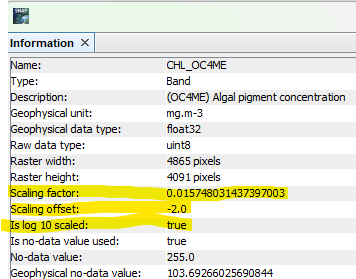
You can find out if scaling is applied to a band by opening the Information window.
You can also note the scaling values and apply them when reading them in Python, but they might be scene specific.
Marco from EOMasters - Mastering Earth Observation
Dear Marco,
I’m so sorry I can’t understand well what you mean.
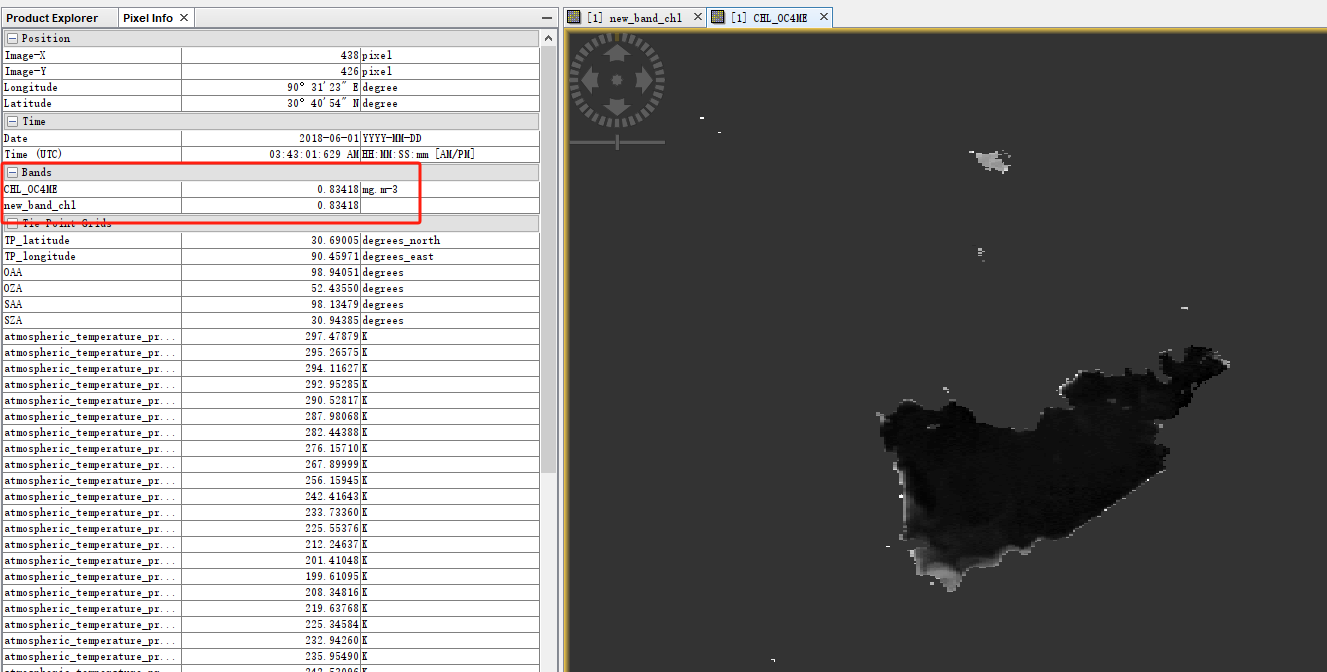
I used Band Math to build a newband of CHL_OC4ME, named new_band_chl, but the raw and new data is the same? Where can I get the offset and scaling factor? Thanks a lot.
It is good that in SNAP the same values are shown. In both cases it is the geophysical value.
You will see a difference when you save the data to GeoTiff and open it with some other software.
You can open the Information window from the menu:
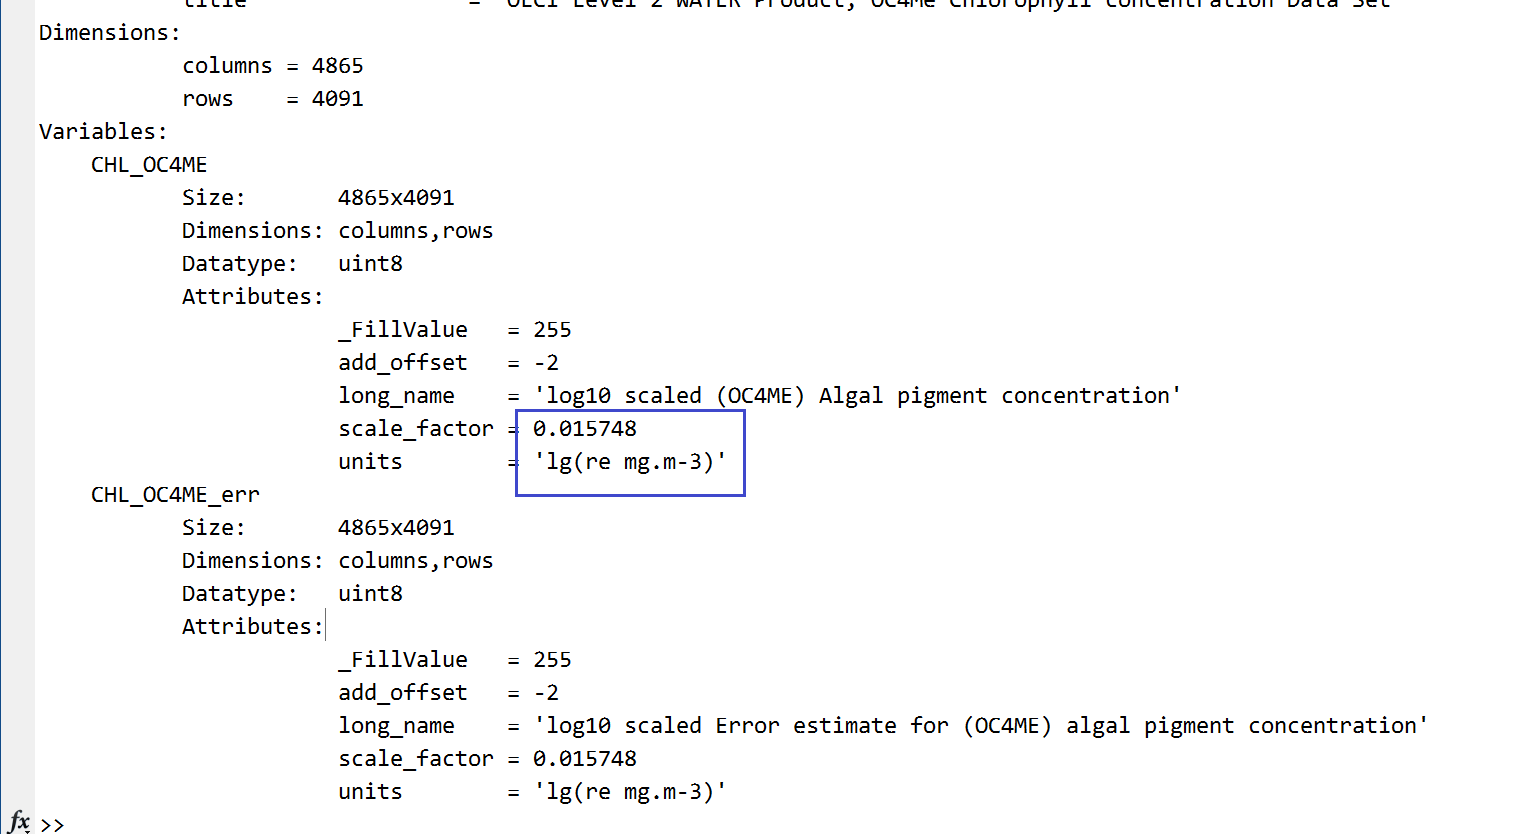
There you can find the scaling values.
The equation from raw to geophysical value is: value = 10^(raw * scalingFactor + scalingOffset)
By the way, you can also create a band showing the raw value.
Create a band using Band Maths and use as expression: CHL_OC4ME.raw
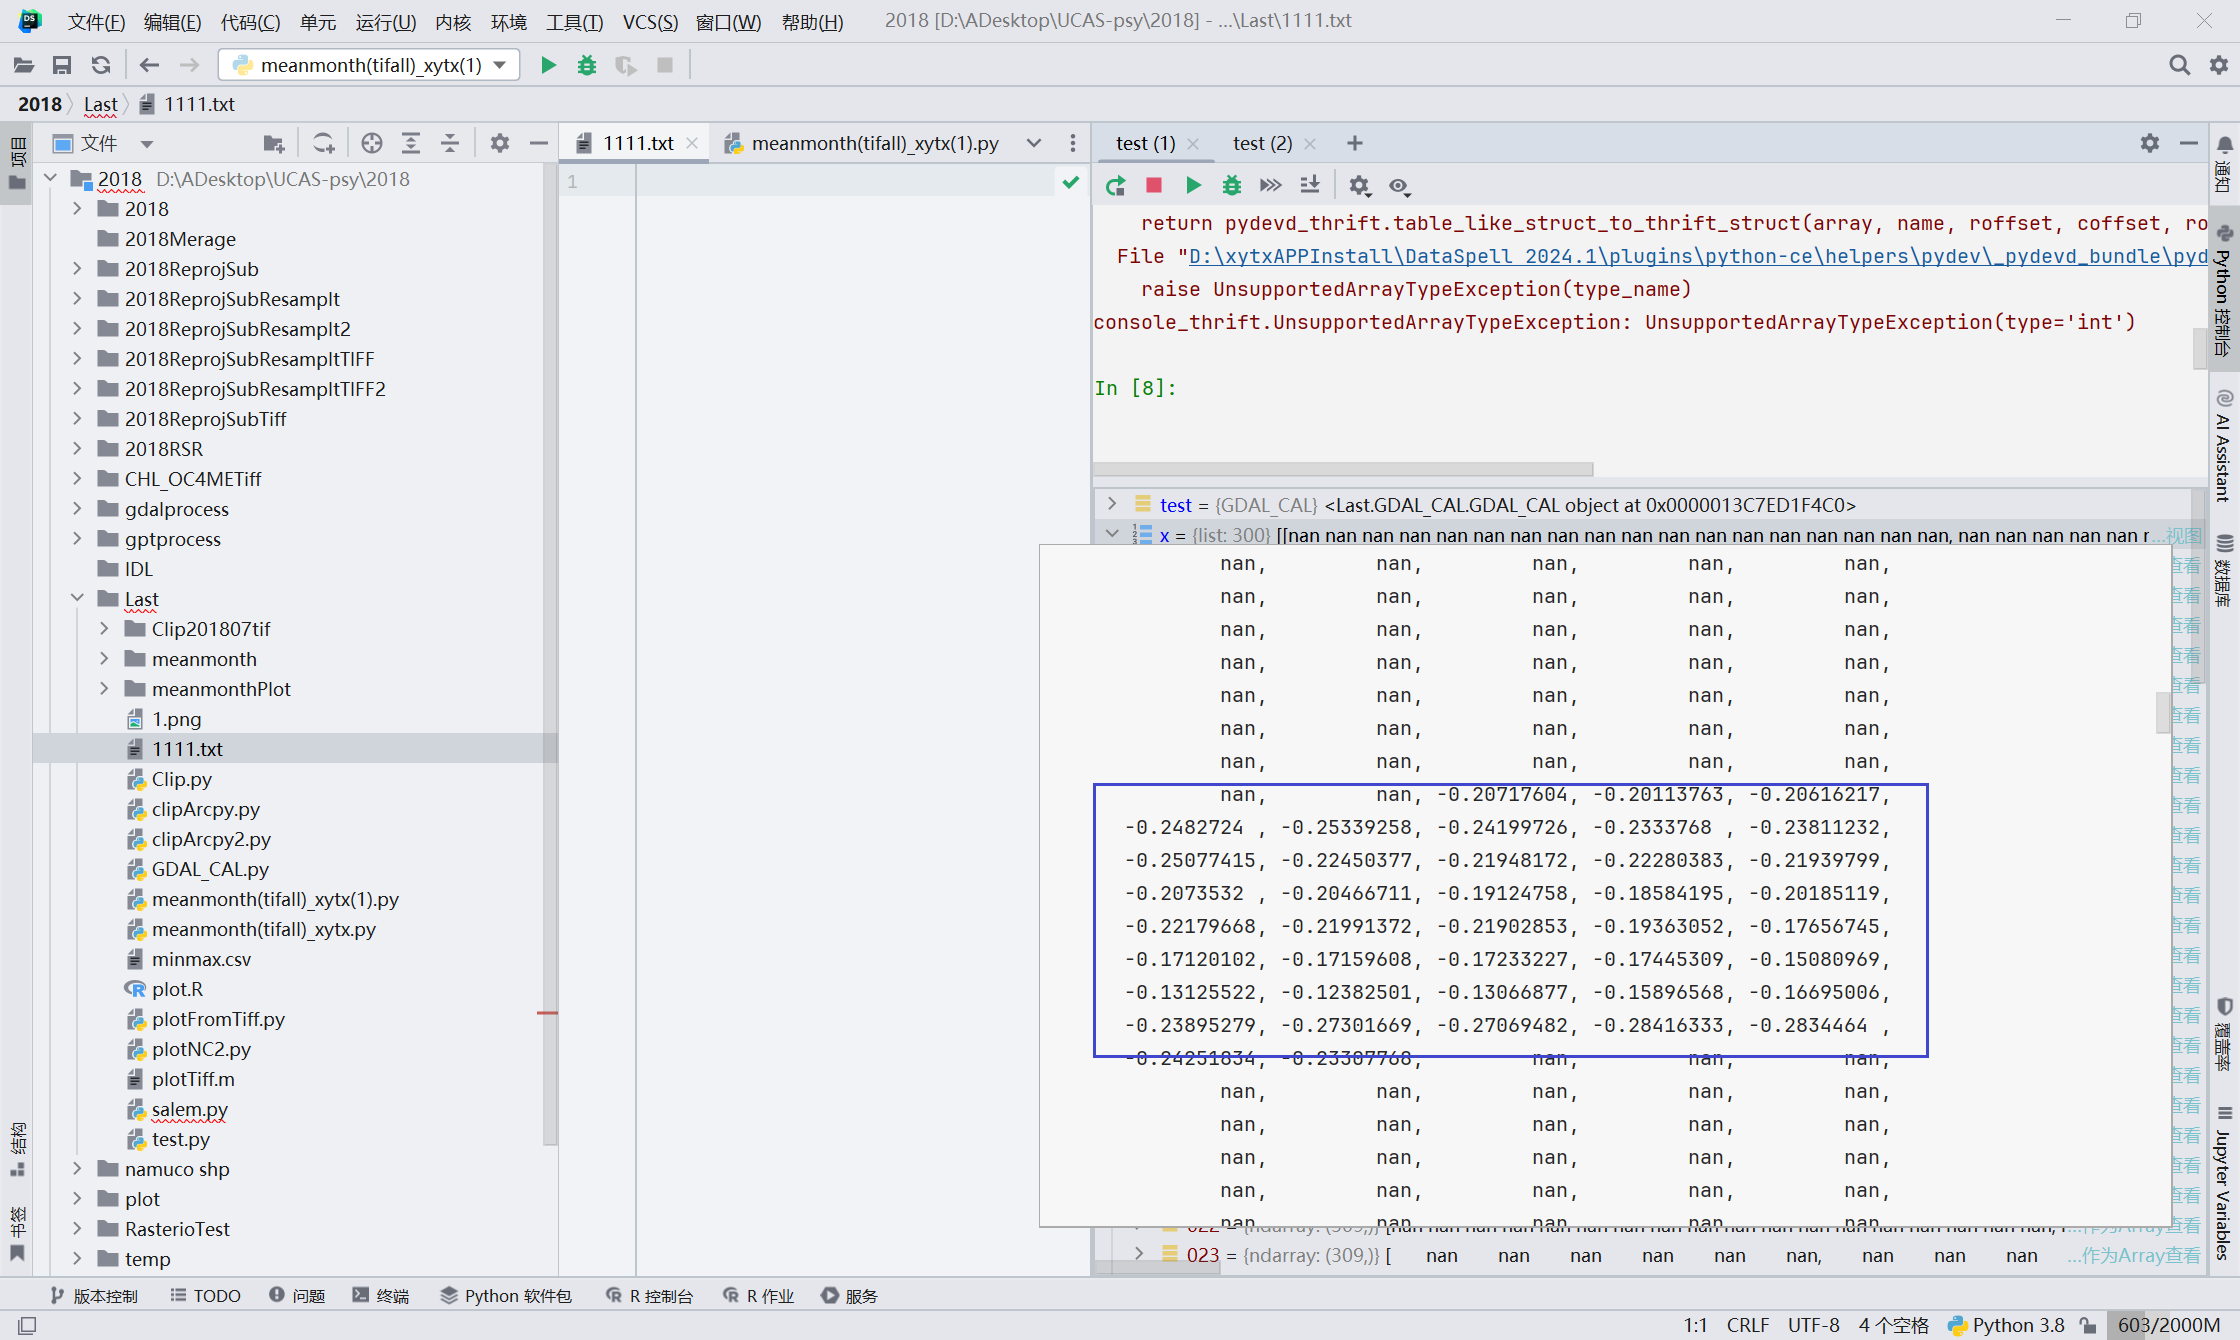
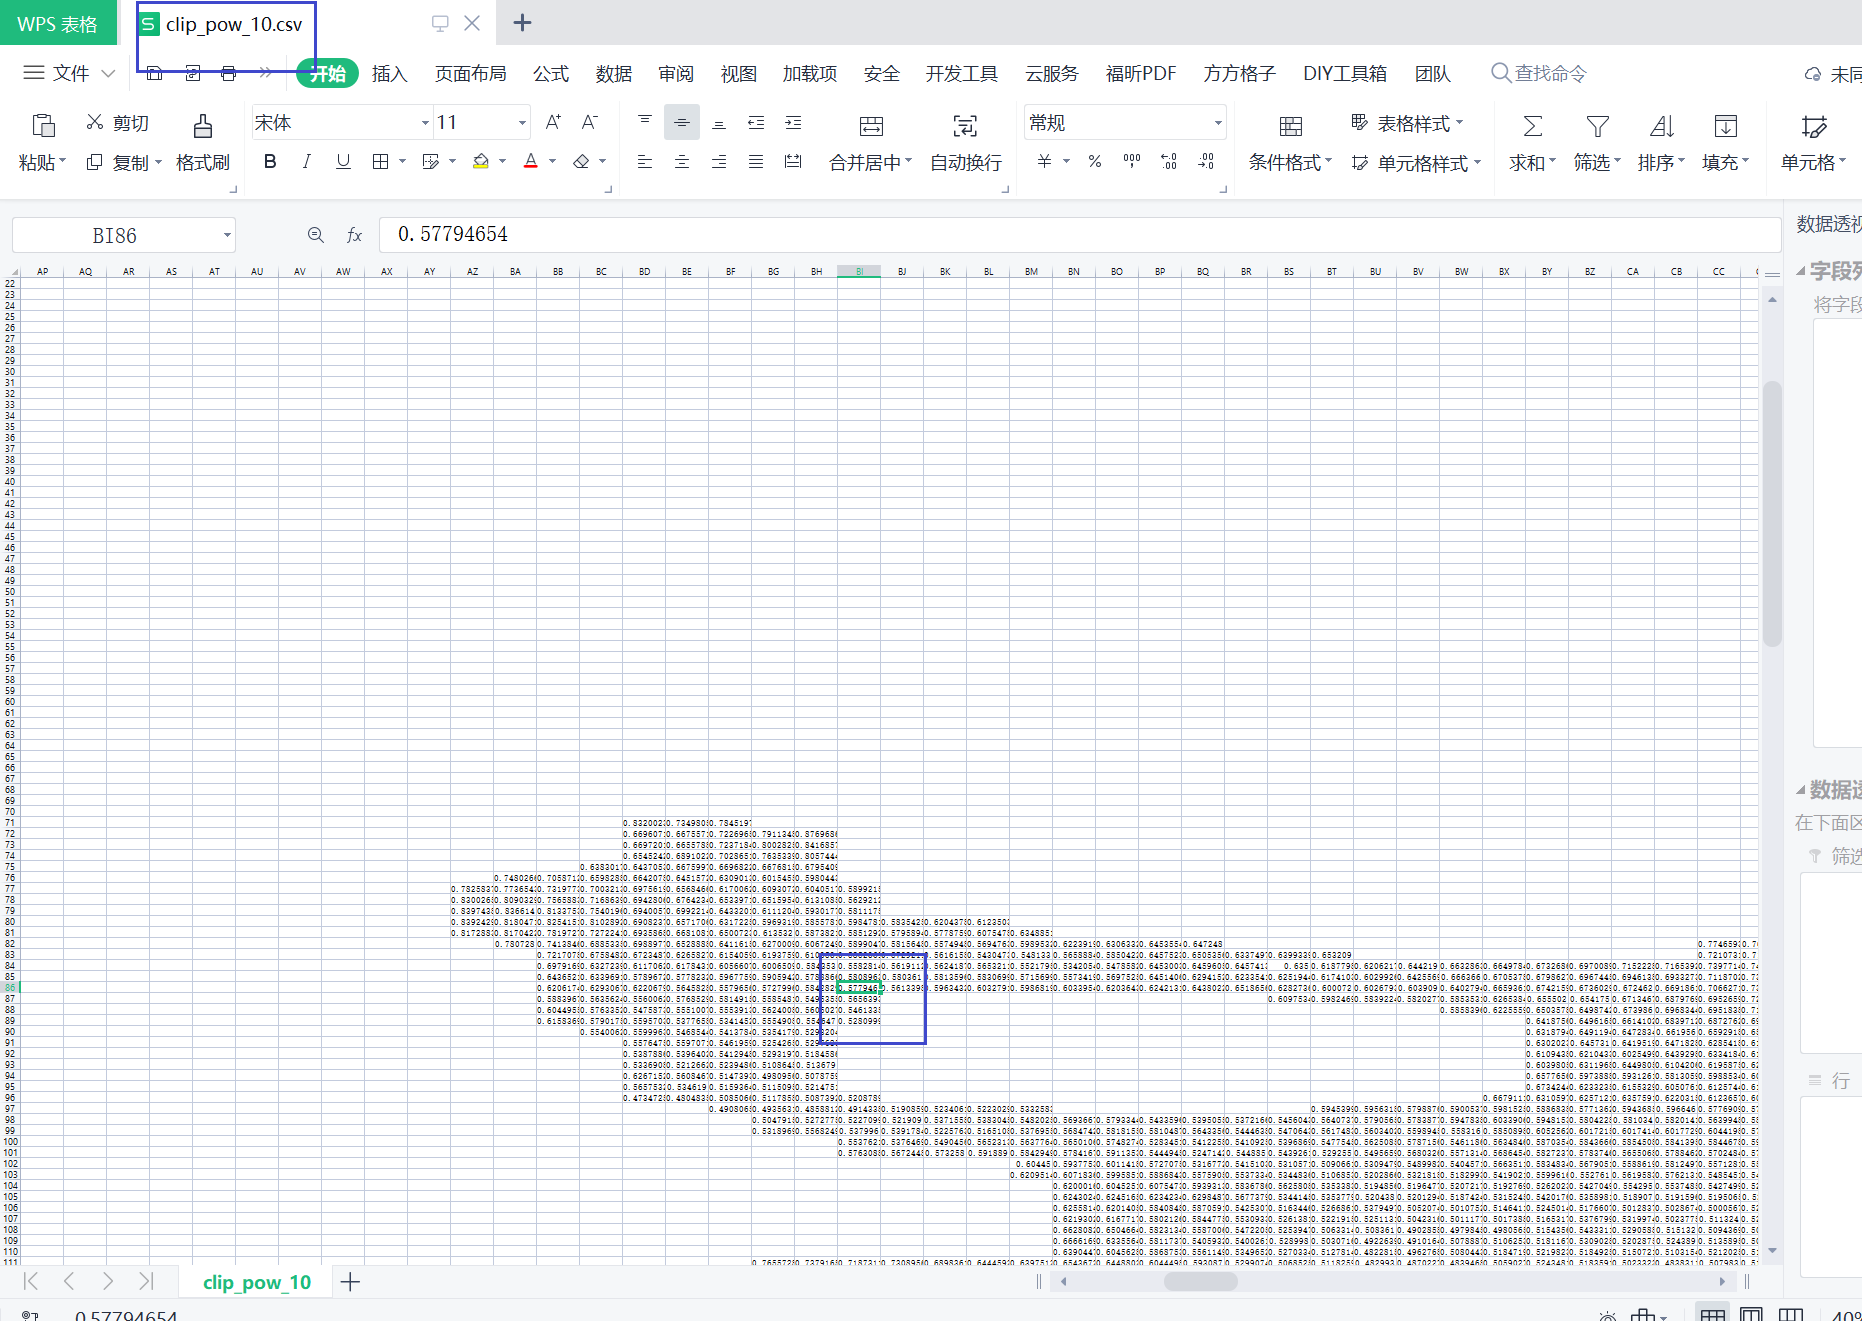
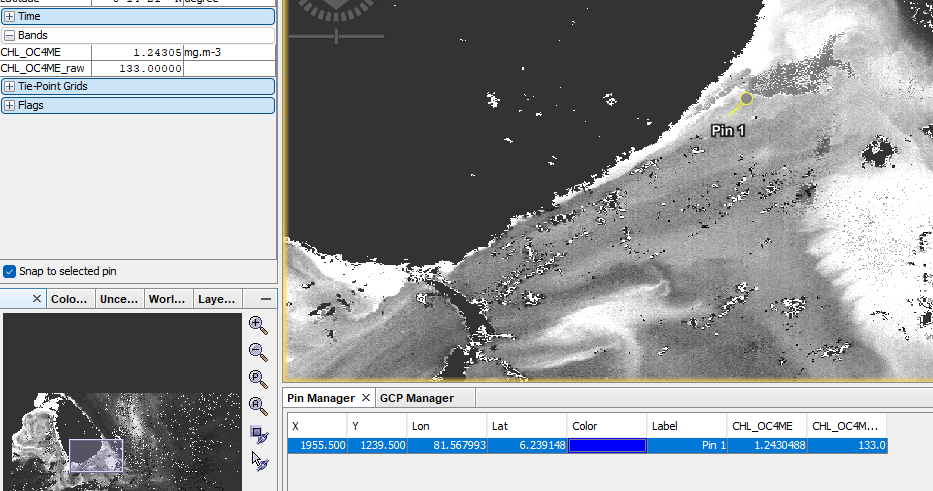
However, my data shows a direct lg between raw and newdata (-0.238112 = lg0.577946), not the value equation you’ve mentioned: value = 10^(raw * scalingFactor + scalingOffset). Can you explain why there’s this discrepancy? Please refer to the following figures:
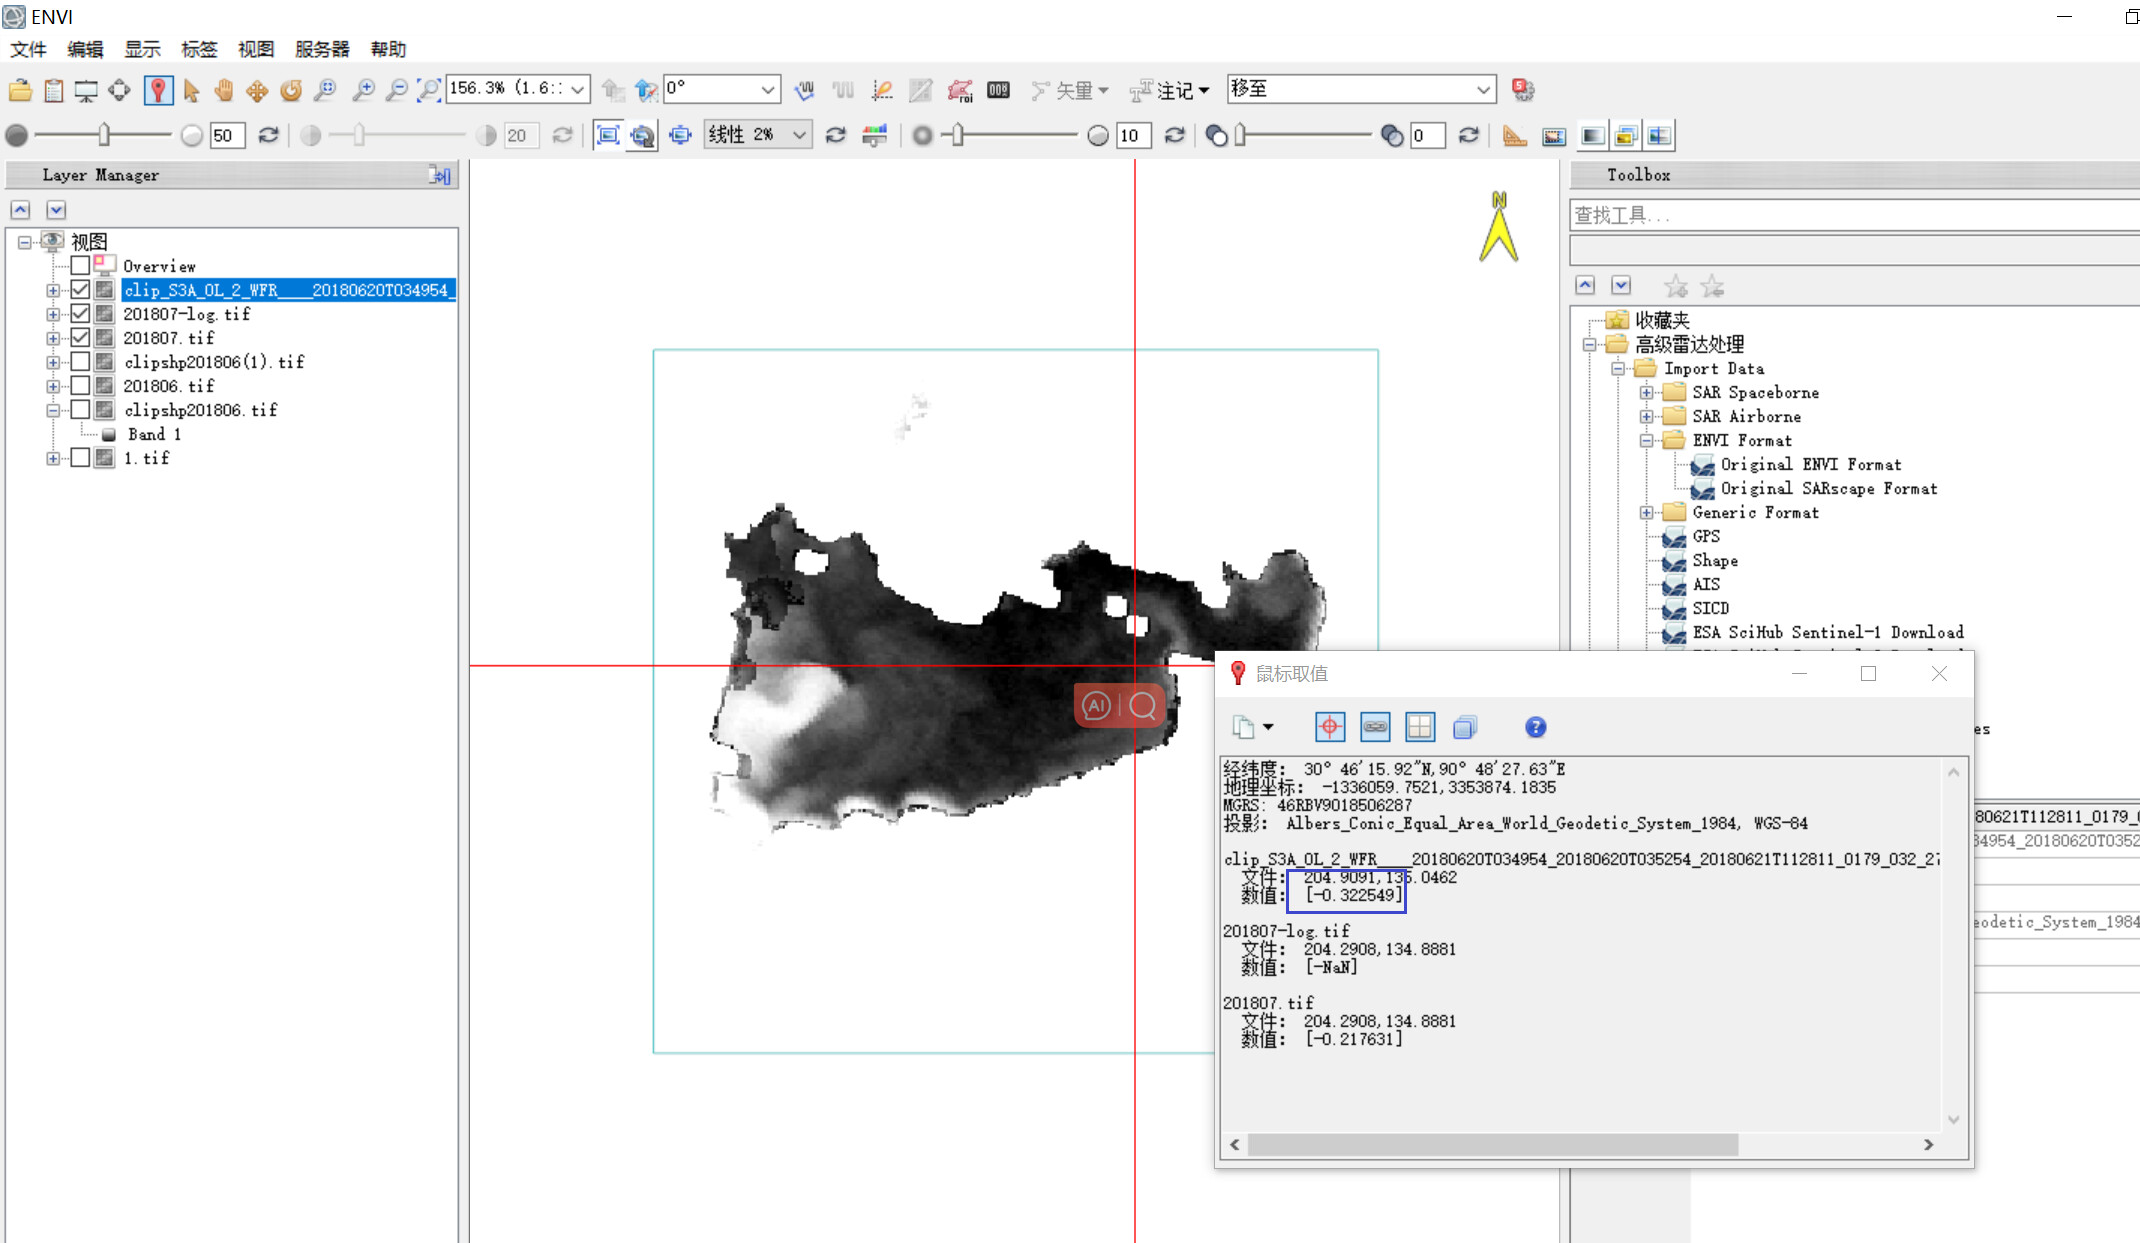
ENVI:
The values read by ENVI, QGIS, and Python’s GDAL, when taken to the power of 10 (10^x), exactly match the values displayed in SNAP. This suggests to a certain extent that the values shown in SNAP have not been taken in logarithmic scale (lg).
Additionally, I’ve noticed that the SNAP pixel info displays units in mg/m^3, not lg(mg/m^3) as in MATLAB.
But raw data cannot be a floating-point value. The raw data is of type unsigned 8Bit-Interger and thus has a value between 0 and 255.
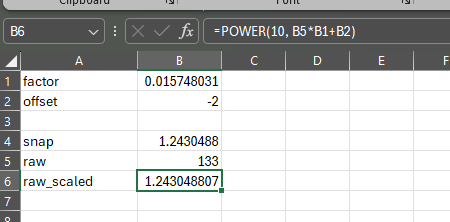
-0.238112 is the value when only applying the offset and the factor, but not the 10V.
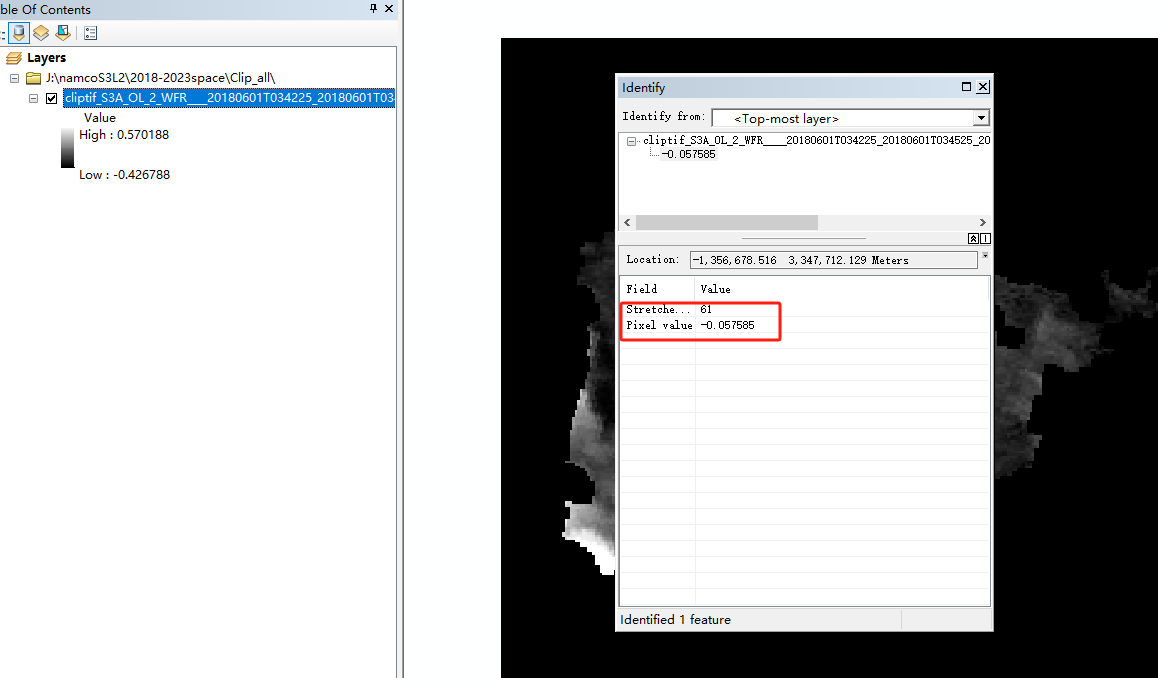
You can see it here. I have created a raw band as described in my previous post.
Using this value and applying the equation I come to the geophysical value SNAP displays by default. You can see it in this Excel screenshot.
Yes, the geophysical values are not log scaled anymore. Only the raw data is.
So, the unit which Matlab shows is actually confusing. The values shown, are half-way converted,
and the10V still needs to be applied. SNAP will show the same when opening the NetCDF directly. This is corrected for the full Sentinel-3 product.