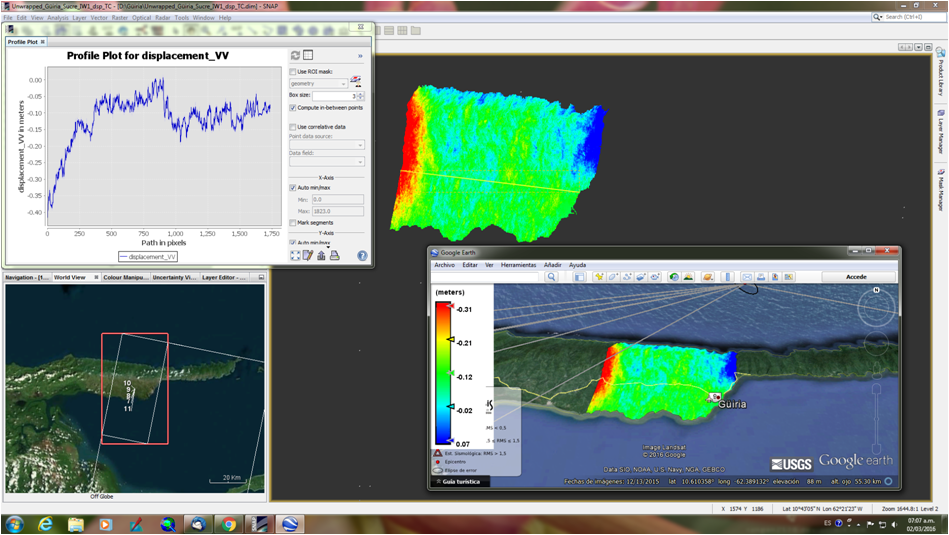
I’ve created a vertical displacement map for my ROI, according to the Nest tutorial in Ruhr area. (I only changed the wavelength 55 mm because Sentinel datas)
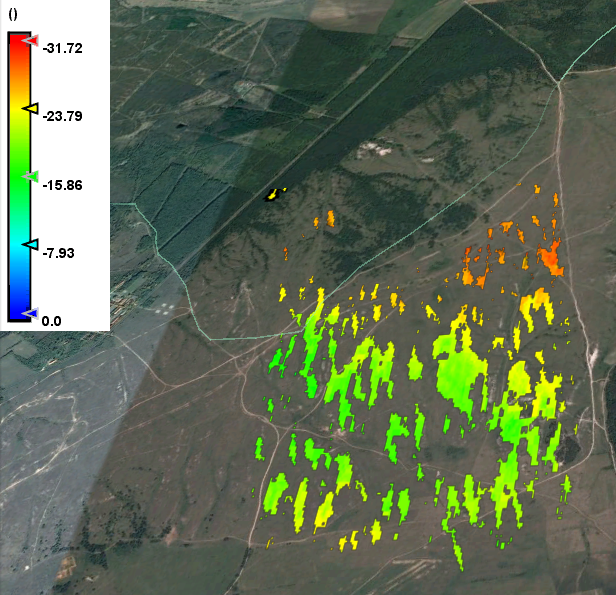
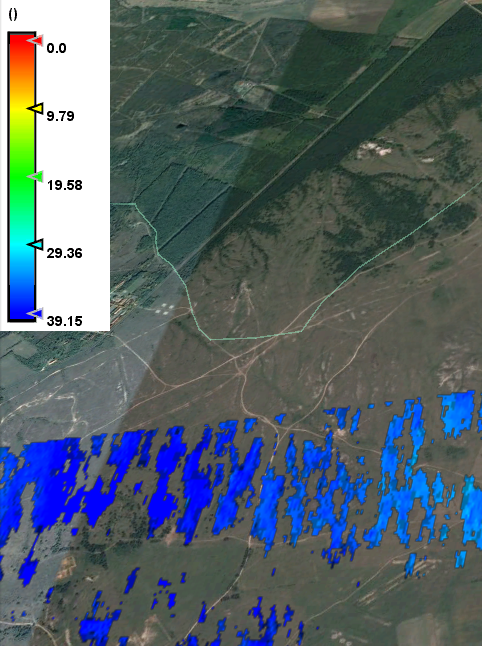
Picture shows the vertical displacement between
7th of June and 19th of June.
7th of June and 1th of July
19th of June and 1th of July
For the 1st and 2nd pictures I understand the trends of the values, both subsidience (somehow I find 1.5-3 cm too much, anyway…)
But according to these two, the 3. picture should show minimum displacement around 5-6 mm.
It looks like senseless datas. Does anyone else same problem? or solution for it? Thanks
Did you check InSAR Stack Overveiw ?
(Redar -> Interferometric ->InSAR Stack Overveiw)
Some time it shows Master and slave are reverse.
I think this may relate the analysis result.
Do you have any idea ?