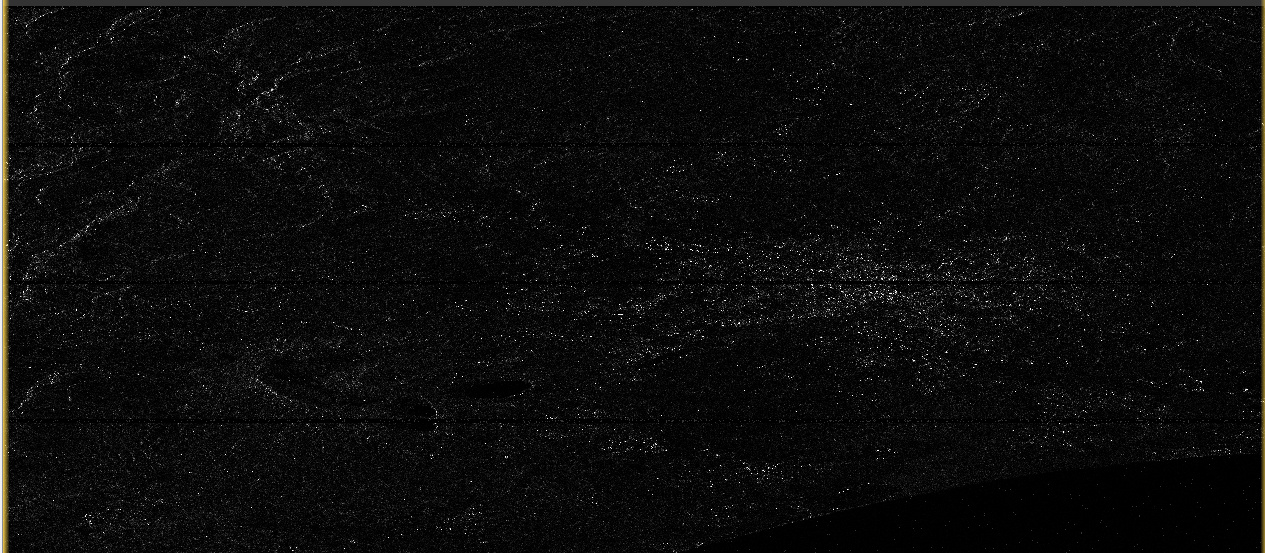
I recently came across a dataset (IW1_VH for S1B_IW_SLC__1SDV_20191227T051927_20191227T051954_019546_024F01_D3BA) for S-1 that has some very bright pixels in it (Between 1 and 3 powers of 10 brighter according to the pixel info window). This makes it rest of the image all very dark. Below is an image of the dataset when I first load it into SNAP (The only operation ):
Currently, I have been using Band Maths to find the very bright pixels and move them down to a value that places them more within the range of the rest of the data (essentially a lowpass filter). The equation I use looks like this:
if Intensity_IW3_VH > bright_val then
    Intensity_IW3_VH * (not_as_bright_val / new_band_3)
else
    Intensity_IW3_VH
where bright_val is a a number right below the pixel values for the very bright spots, and not_as_bright_val is a value right above the largest value.This accomplishes my goal of clearing up the range of pixels values to be eaiser to interpret, but I am concerned that this method will affect the quality of the data.
Is there a better and more proper way to correct this, or is this the best approach?
Calibrated backscatter intensity largely ranges between 0 an 1, but artificial surfaces and volumes can have extremely high values beyond that. This is usually tackled by converting the data into dB scale. This shifts the maxima towards the mean and stretches the dark areas with little contrast.
Cool. I have been using the log view mode before as well, but I was wondering if that was the best way, as the very high valued returns are not exactly “normal”. Additionally, in this case, even after using the right click to convert to log, there are still a couple very bright points.
Should I then perform all of the processing (calibration, terrain correction, etc) on the db scale elements, or should I process, and then convert to db?