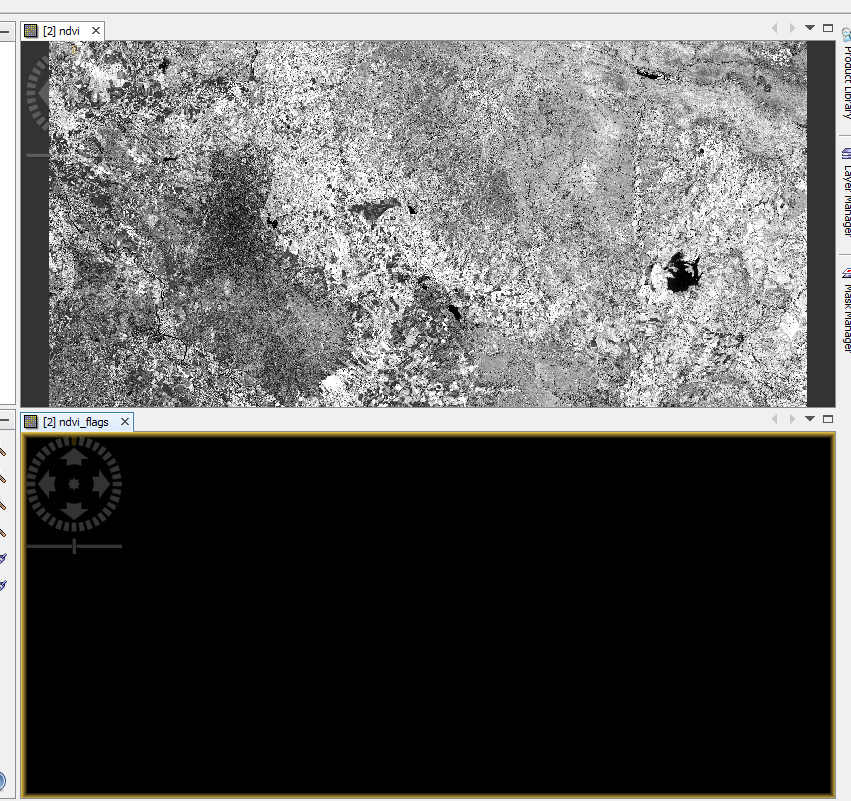
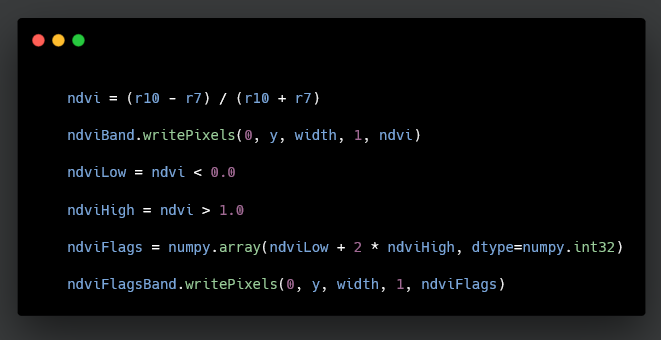
I hope you can forgive my ignorance. I am calculating NDVIs with snappy basically with Sentinel 2 L1C image. I can calculate the proper NDVI and also the NDVI flags (from the example in this link) but I was wondering. What are the NDVI flags and how to define the thresholds (NDVI low & NDVI high). So far I have been testing with some random values and when I plot them I just see a dark image.
The flags generated in the python example are just showing the concept of creating flags.
The two threshold values (0.0 and 1.0) might never occur in your data (both exceptional cases). Then no flag is raised. Check the histogram of your ndvi data for the value range.
However, you can also change these thresholds. For example to 0.2 and 0.8.
Thanks a lot for your answer, I guess I will have to calculate the mean and standard deviation for each ndvi frame though.
Is there a snappy operator that allow us to extract the “stdd” and “mean” from a “.dim” file? (similar to gdal.stats)