Hi and thanks for reading.
I’m processing Sentinel 2 images with Sen2Cor without using the SNAP toolbox.
With my settings I receive MSK_CLDPRB_20m.jp2 as part of the output which I would like to use for further processing. Now I’m trying to find a description of what these values represent in the various product description guides, but so far with no luck.
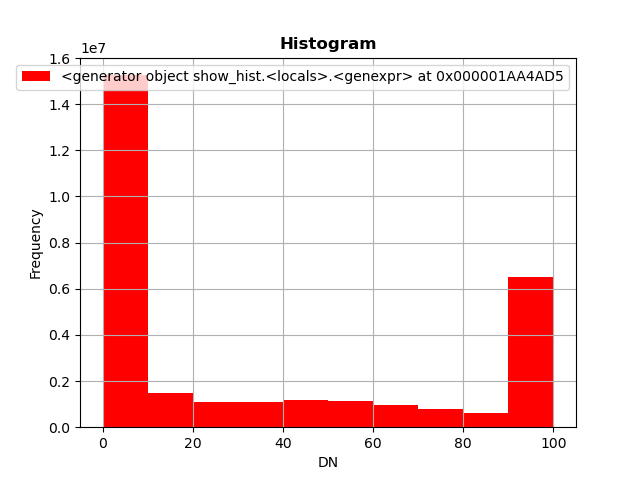
Since it is a probability I would expect numbers between 0 and 1. In the downloaded images however, the values seem to draw a Gauss-like spike around 100, i. e. more like a distribution function. In the example file I have open right now (which is quite cloudy), the maximum value is 139.
Before starting guesswork I would like to ask if someone can shed light on this so I can handle the numbers properly.
Thanks and kind regards