Hi gefal,
I’m also struggling to understand what exactly the pixel value represent, maybe I’m missing something and I would love to get some input.
Adding to this, if I open the file MSK_CLDPRB_20m.jp2 in Python with Rasterio and show its histogram I get the following plot:
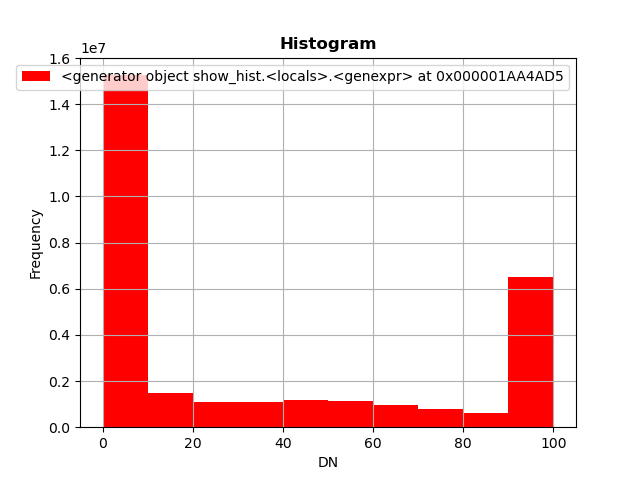
In addition, cldprb_array.min() = 0.0 and cldprb_array.max() = 100.0
The very same file directly opened in SNAP yields a max value of 140.

The plot thickens…