Please tell me about what workflow should I adopt for Generating DEM and Displacement Maps using Sentinel 1 Data. Basically I have performed the processes many times but just need to confirm something. 
Have you seen these?
1 Like
Yep have read them already. Basically I have two complex images and was curious wether I can generate DEM and Displacement Map using same pair.
Master and Slave are 10 days apart temporally and with perpendicular baseline of 5 meters.
Only difference
To generate interferogram “for DEM” I don’t subtract topo-phase and in spahu export I set the mode to Topo
For Displacement I subtract topo-phase and snaphu export mode to “Defo”.
Thoughts?
This works for displacement but not for DEM generation.
What sensor are you using?
1 Like
Sentinel 1 IW 🤷🏻
For DEM should it hit critical baseline?  any decent number?
Then 10 days is not possible. It must be a multiple of 6, otherwise the images were not acquired from the same track.
As written in the tutorial, 150-300 m ideal for DEM generation
2 Likes
Exactly you’re right it 12 days. I forgot, nonetheless here!
So you’re saying that this pair is good for Displacement but not for DEM? Let me tell you why I opted this pair. A friend of mine said that there’s a tradeoff between temporal and spatial baseline.
For DEM either go with greater perpendicular baseline and smaller temporal baseline vice versa.
So I thought the results are going to be good if both master and slave have small baselines. And that what if I create DEM and Displacement using this small baselines. After all a phase shift is required. I had SRTM 60 meters boom in my mind, but a lot to consider I know, that was single pass XTI and this is Repeat Pass DInSAR (XTI).
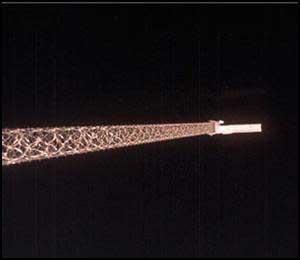
SRTM 60 meters boom having receiver antenna at the end.
@ABraun This is just experimental are the results going to be good? Should I continue with both DEM and Displacement or save my time by not performing DEM. Please suggest
Displacement needs small perpendicular baselines, but DEMs need baselines above 150 m for small height ambiguity.
But creating DEMs with Sentinel-1 is hard because of temporal decorrelation. This is different for SRTM which was a bistatic mission where a smaller perpendicular baseline is tolerable.
1 Like
Got that. Thank you
But I am doing experiment will share the details of both on the same thread ok? Right now I am batch downloading several pairs greater than 20 GB in size. But I am excited for the pair with 5 meters baseline. As all other pairs had >50 meters. Thank you for guidance. You always help a lot in understanding basic concepts.
Sure, feel free to share in here.
The ASF Baseline Tool helps you finding pairs above 100 m, it’s mentioned in the DEM tutorial.
1 Like
Ok so displacement map.
Here’s the interferogram even I debursted it I see this strange kind of strip. Not sure what’s that.
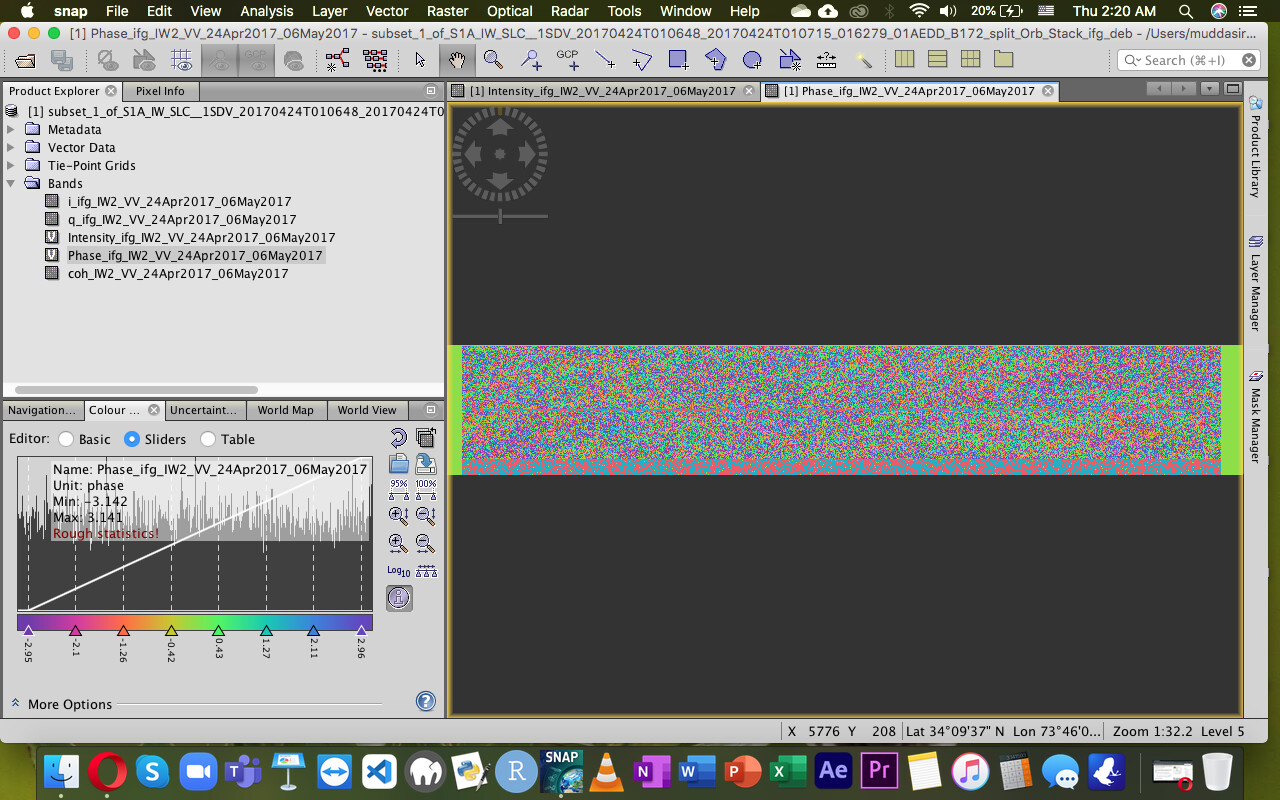
Phase

Phase Filtered
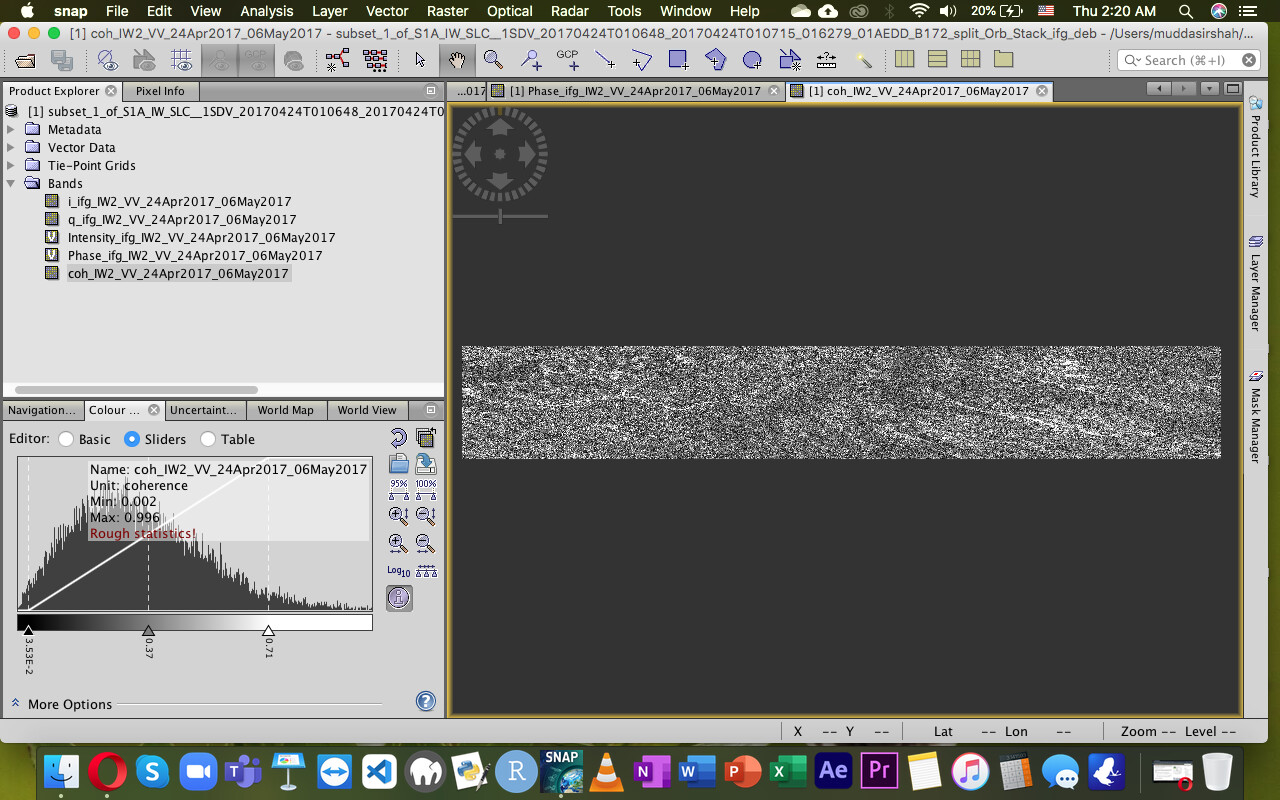
Coherence
…
…
…
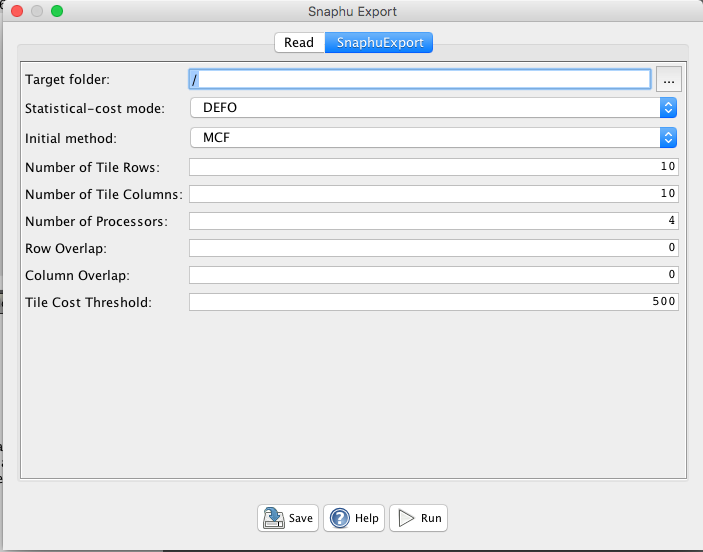
Snaphu Export Settings
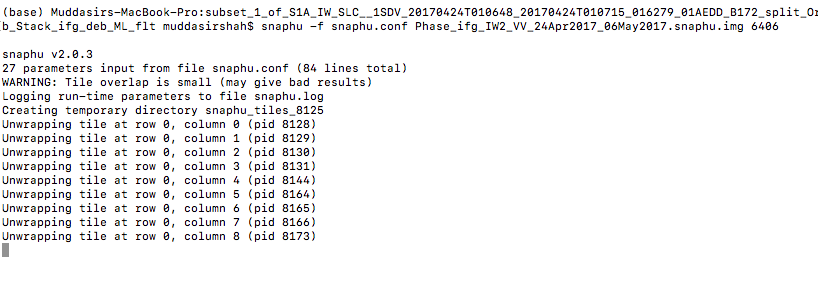
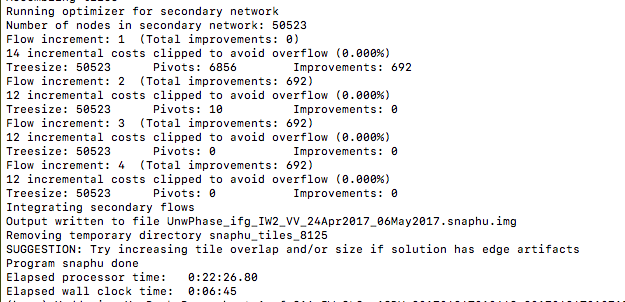
Snaphu Log
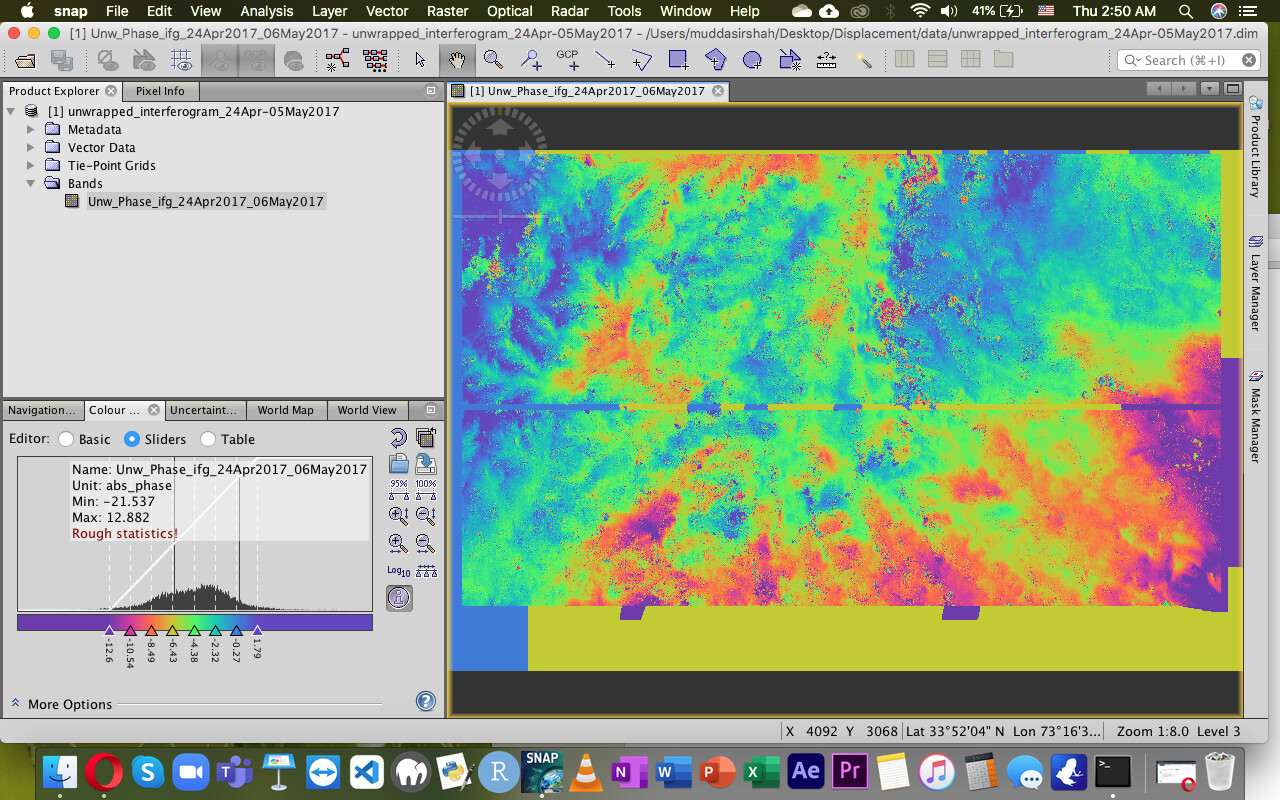
Unwrapped Phase
I know very dirty results but kindly guide the export settings @ABraun

Displacement Map
at which step did you apply TOPS Deburst?
1 Like
After interferogram formation. Multi-looking and Debursting.
Anyways I will deburst after stacking (Coregisteration) . But I am worried about this unwrapping settings. I understand the concept of row and column overlap in the image link you sent but while snaphu exporting what settings should I keep for displacement and DEM I want to learn that.
Or after TOPS Splitting I will deburst individual scenes. 
Snaphu export setting is the issue right now
Don’t apply multi looking before debursting.
Overlap size is not determined by the use but the size of your raster and the number of tiles. 200 is a good start.
1 Like
Alright. Will let you know but look at the unwrapped interferogram it’s kind wrapped in majority of image. Those edge artefacts etc
First of all thank you so much @ABraun 

Well I’ll share all the details of everything but this made me happy and excited so thought share this first. I know I have to tell you a lot! And I also don’t know if it’s correct or incorrect, apparently seems fine.
ok so here’s the sentinel DEM I created using that 05 Meters-12 days baseline I uploaded to my Google Earth Engine Assets. I did a comparison of my DEM and SRTM DEM and it’s pretty convincing.
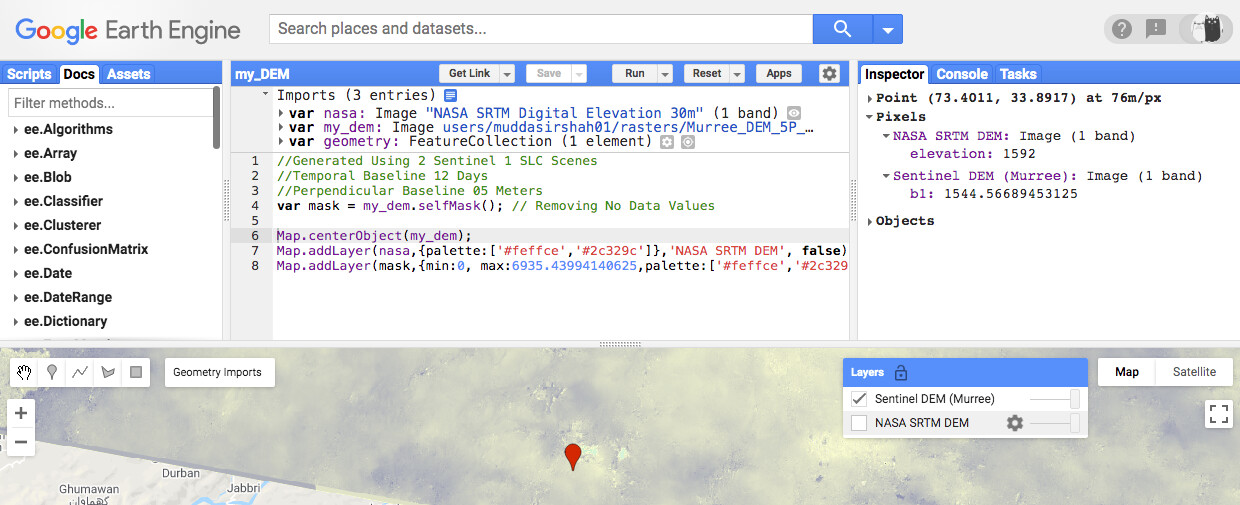
If you look at inspector in the image, I selected my study area point and the SRTM DEM shows 1592 meters Elevation while my DEM shows 1544 meters. Difference of 50 meters. However there were some points that showed maximum difference of 300 meters and I understand that perpendicular baseline plays an important role, mono-static vs bi-static thingy you mentioned earlier. I started with tile Threshold 200, number of tile rows and columns 20
Waiting for your response
P/S
I also did the displacement map and will share screenshots of unwrapping configuration, phase etc etc
there are many ways to assess the quality of a DEM. You can sample random points inside the S1 DEM (for example 1000 points) and extract values from both DEMs (S1 and SRTM) at their locations to compute the coefficient of determination R², but also the mean absolute error (MAE) and the Root Mean Square Error (RMSE). Yet, all of them only show the deviation of both datasets and these do not show where the errors occur. But if you then calculate another S1 DEM you can compare these measures and see which of them is statistically closer to the SRTM. I’m pretty sure image pairs with larger perpendicular baselines will give you better results. But in the end, the presence of vegetation, especially near your area of interest, is the most important factor which degrades quality for repeat-pass InSAR DEMs.
Depending on the use of the S1 DEM you should also calculate a difference image between S1 and SRTM to highlight where the errors are the largest and if these are systematically distributed over the study area. So a large R² or a small RMSE do not necessarily mean that the DEM is usefuly for your purpose. Creating hillshades helps you identifying locations of high and low quality as well.
A review on how to assess the quality of DEMs is given here: https://www.sciencedirect.com/science/article/abs/pii/S0924271609000276
I have written a review paper on DEM generation with Sentinel-1 data which will hopefully be publicly available within the next coulpe of days
Just a thought - instead of uploading all S1 DEMs, wouldn’t it be easier to download the NASA DEM and do the comparisons in a GIS?
2 Likes
Yes its for sentinel 1.