Why gelbstoff absorption coeff. at 443 nm

Please stick around in the forum so we other can also benefit from your discussion.
And I think the upload of the image did not work.

Am I not writing in forum?
The image of 30 January 2019 again I processed for normalised reflectance, it is giving correct values; I think earlier there had been some file writing problem in my system folder.

How to take a ploygon subset of CR2CC processed normalised reflectance? Is there any video link etc. for making a polygon subset from main image?

You do, but you mentioned also communication via email. That’s why asked you to stay in the forum.

There are multiple ways of doing a subset.
if you want to do on a batch of products you find here a discussion which can help you:

You can also use the graph builder. Or you just use the subset operation. But there you can only specify the corner coordinates of your area. This would be done with the options too, because the image needs to be rectangular at the end.

Thanks marpet. With graph builder and importing shape file in graph builder I could do subsetting according to my Region of Interest (ROI) and could analyse the data very fast.

how can I use cr2cc processor in graph builder and subsequently use it in batch processing after loading graph builder file? Not able to find cr2cc processor in graph builder?

Sure, we would stick in the forum so that others can also be benefited instead of on emails.

1 Like

C2RCC is not available in the graph builder, they are not compatible with each other.
You need to create the graph XML file manually. Or you can create the part without C2RCC in the graph builder and then add it later to the stored file.
The batch processing also struggles sometimes with optical data even when not using C2RCC.
If you want to do batch processing I would suggest that you follow this guide: https://senbox.atlassian.net/wiki/spaces/SNAP/pages/70503475/Bulk+Processing+with+GPT

Thanks a lot marpet for your quick reply and guidance regarding batch processing.

Hi marpet
I am analyzing two parameters using Analysis–> Scatter plot. Can I change the one of the axis to logarithmic axis?

No this is not possible. But you can export the data and use it in Excel for example

Thanks Marpet. Thought need not go to excel, will do it in snap only.But now I am doing in the same way in excel only!

Hi marpet,
Hope you are doing good. I am using c2rcc processor (want to change the flag). In this connection I would like to understand that what is the meaning of the following flag (default in c2rcc processor)

!quality_flags.invalid && (!quality_flags.land || quality_flags.fresh_inland_water)

C2RCC will be applied when your data is not flagged as invalid AND (is not land OR is fresh_inland_water)

1 Like

Thanks a lot.

Can I get the documentation on IOP bio-optical models used in c2rcc processors. I want to know the apig, adet and agelb models, so that I can tune these models according to bio-optical parameters in our waters! Do I have to write some script for changing those parameters or i can do it in c2rcc processor?

The ATBD for MERIS 4th reprocessing is linked in the help.

The ATBD for OLCI will also be linked in the next release.
You can access it already here:

And this is the direct link to the MERIS ATBD.

The bio-optical model didn’t really change and is actually also the same for Sentinel-2 data.
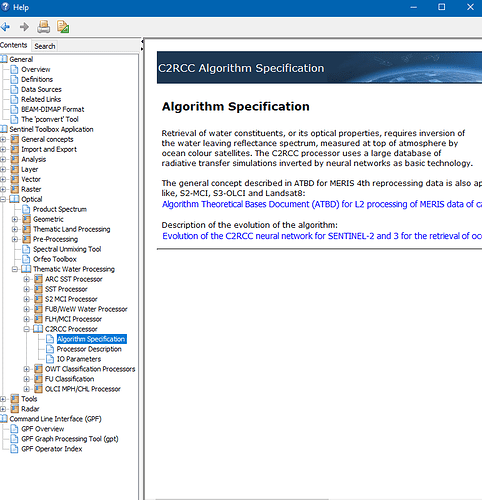
Thanks. Will go through it.

Hi everone,
I have imported some point vectors (my station locations, see displayed map) in an image and I want to display station names as S1, S2 etc. in the map, as shown by white colored text. Can I display station names. I have made the vector data with attributes S1, S2 as 3rd field (1st and 2nd fields are long, lat )

If they are points, you could open them with the Pin Manager. It allows to change the pins properties (colours, names) manually.

Thanks. Could do it with pin manger.