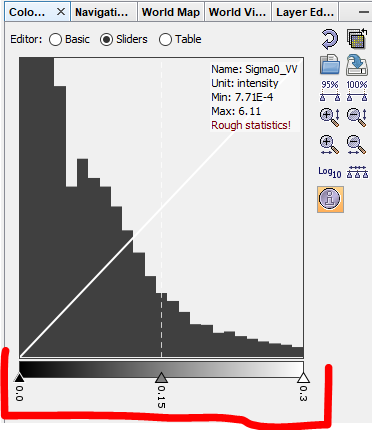
as stated in the Color Manipulation tab, the statistics are only estimated by a number of pixels. To get the most accurate numbers, you can use the Statistics tool on the raster before and after coregistration.
Another reasons for the changed values might be that the extent of the image changes after resampling it to the extent of the reference image.
Thank you for your explaination! I redo the coregistration using nearest neighbour resampling method as @mengdahl said, but the colour changing still existed. However, I linear the 2 images(before and after coregistration) to dB, and their Statistics result were very similar, so I think maybe the coregistration result is reliable? The color shift still exist:
the color is just a matter of stretch (more obvious in the linearly-scaled data, less visible in the log-scaled data). Please make sure to apply the same minimum and maximum values in the Color Manipulation tab to make the images visually comparable.
If conversion to dB makes sense or not depends on the type of information you want to identify. If you want to separate urban from non-urban land, the linear scaling gives you better contrasts. If you want to investigate changes within the built-up areas, the dB-scaled data might reveal more details.
Thank you for such patient explaination.
I want to investigate changes within the built-up areas, so maybe dB is a better choice.
By the way, is histogram matching a solution to solve the stretch promblem?