subsetting Sentinel-1 data has reportedly brought errors in some InSAR cases. Try to reduce the data size in the split operator to the smallest possible extent, but leave it at that.
Maybe you can subset after the coregistration. But you have to go sure that both products (stack and interferogram stack) have exactly the same extent.
But If I take the whole image the following problem is occurred:
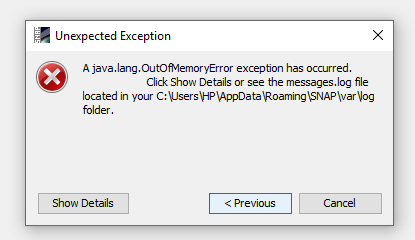
That’s why I created the subset with same co-ordinates. I’ve 16 GB RAM.
out of memory means that even 16 GB RAM, in your machine, but still not enough, do you still use Alos palsar?
Do you have any chance to switch to S-1, in case those cover your study area!
If I take S-1A image, doesn’t it occur space problem in my machine? I’ve not tried yet. Actually the paper I’m following they use Alos-palsar data. So I tried with this. There are only 7 images for S-1A SLC in my area.
Are those Descending or ASC. ? is the same number covers your area in both orbit?
at least better than 5 of the other, however as it is mentioned before at least 20 images, but, I in case you’re doing your master study I’d suggest to change the study area, by other one is covered by more passes,
There are 7 image of S1A, Ascending, same frame and same path, VV polarization.
If I take VV+VH with same frame and path of any other area, will it find the deformation due to groundwater discharge/recharge? I’m trying to find the deformation due to groundwater recharge/discharge. The paper I’m following they take ALOS palsar level 1.1 data(HH polarization,L band), find the deformation and hydraulic head in confined area. I’m trying to apply their process for my area.
Would you please to share your study area if that possible,
To detect the ground deformation related to ground water depletion, it’sn’t necessary to use a specific radar data, for instance I used ERS-1/2 and ENVISAT, in my PhD, and I got a very nice results, but this was 8 years ago,
Please have a look at this from my PhD thesis,
1 Like
My study area is Bangladesh. I was trying a city(Dhaka) from Bangladesh, so that I can match my result with the manual data in the water board. Now I’ve found 40 image of S1A with Path: 150, Frame: 515, Descending, Polarization: VV+VH and Frequency: C-Band of another city of my country. Will it help me in my research?
And thank you for sharing your PHD work, I’lll definitely study it well.
Sorry, I thought it’s about Sentinel-1 data but you mentioned ALOS-2 above…
Subsetting StripMap data (A2) should work, but for PS InSAR you need more than10 images.
Have you visually checked all interferograms if they are correct correct?
Yes, sure 40 images are quite good number for PSI technique, I’d recommend to proceed with this processing, later on I think you’ll find more passes in your previous area. But these 40 images will give you good experience of the processing and how to detect water level fluctuations of each selected PS as well.
These are the outputs of master images:
original:
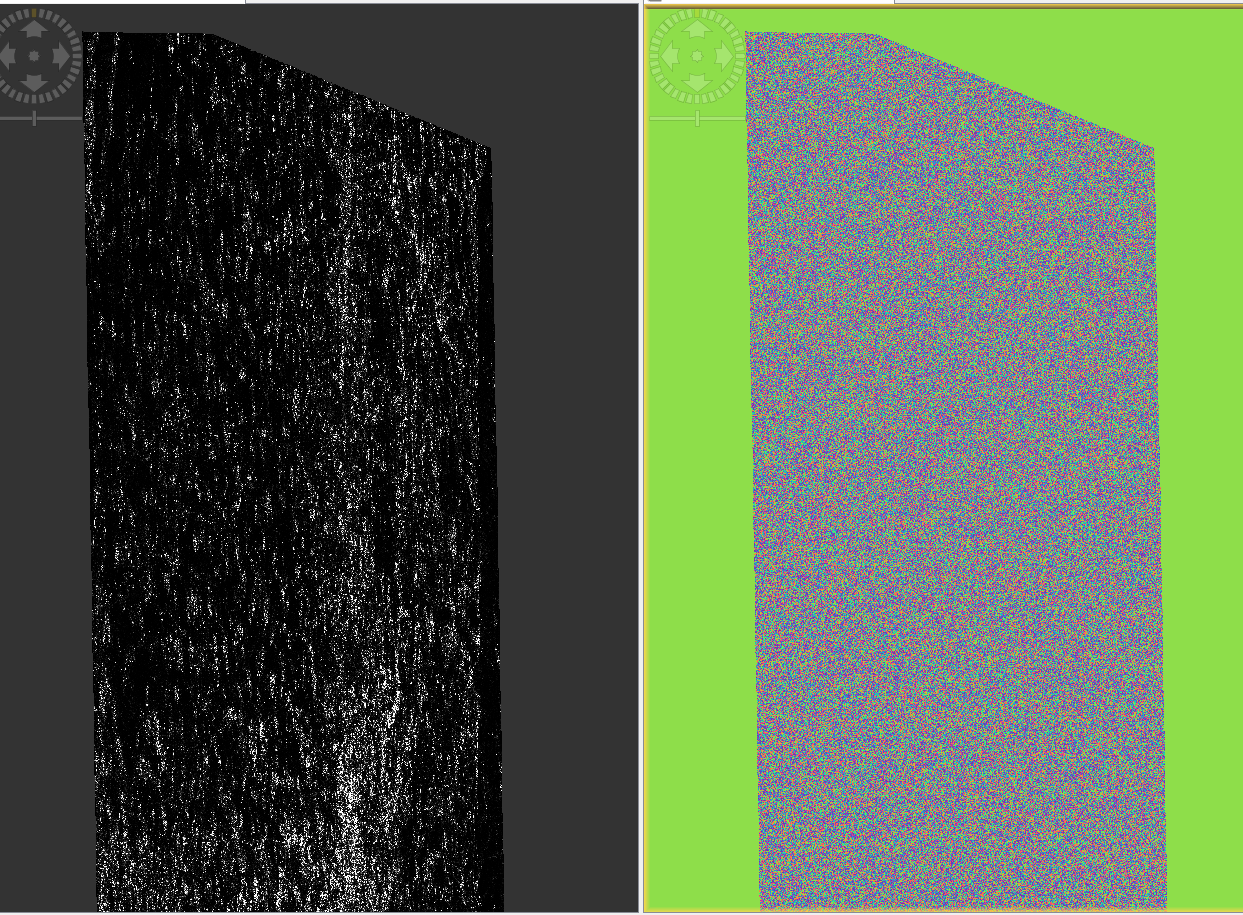
Co-registered stack master:
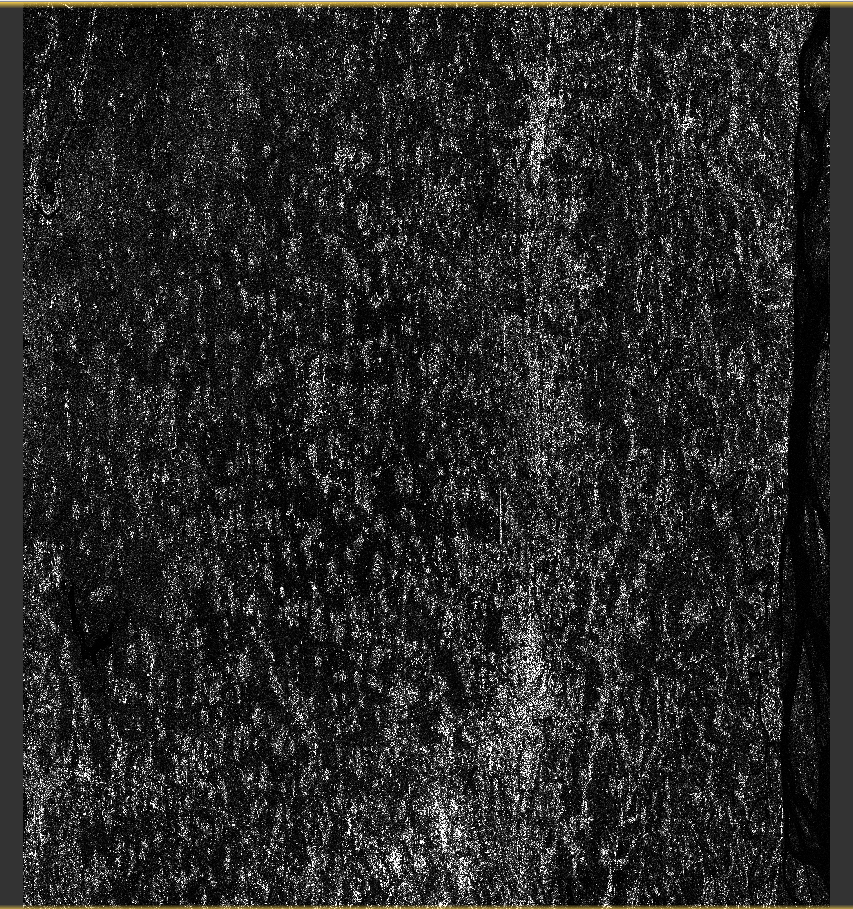
After interferogram(master):
Deskewing:
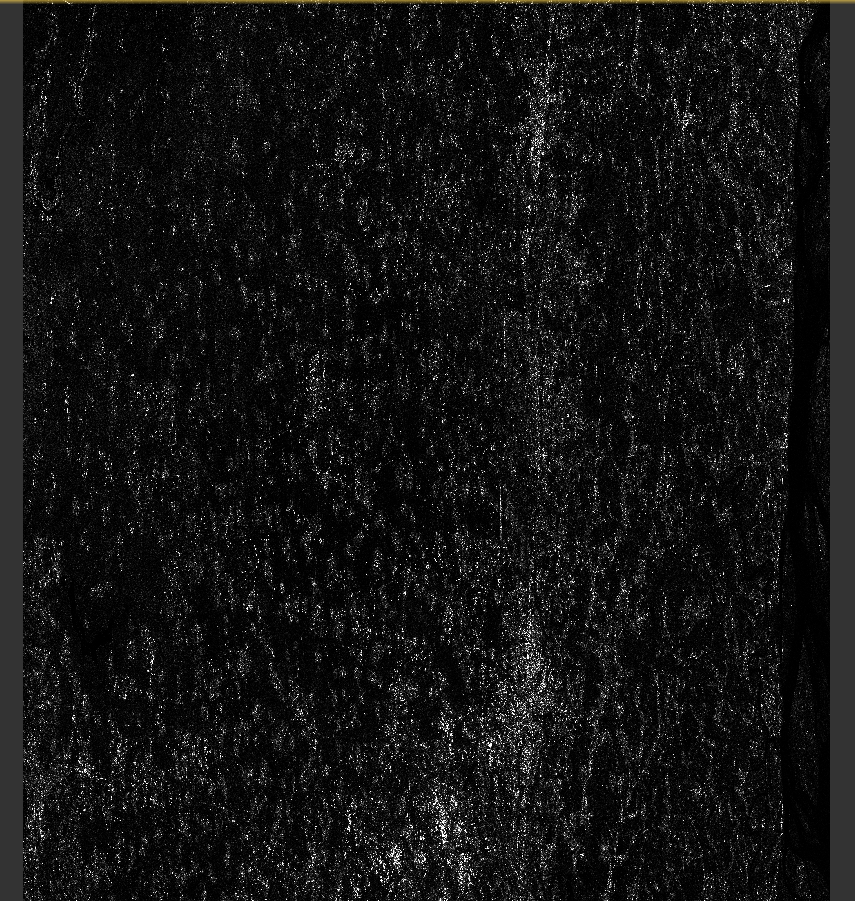
DInSAR:
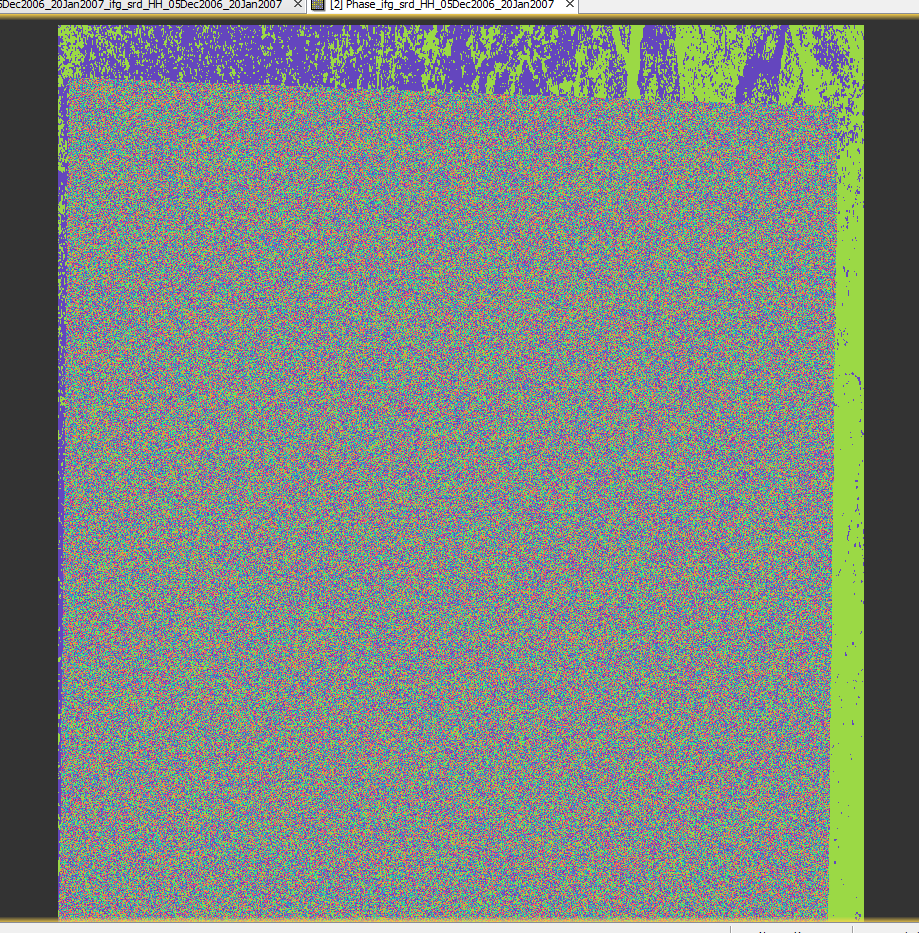
are they correct?
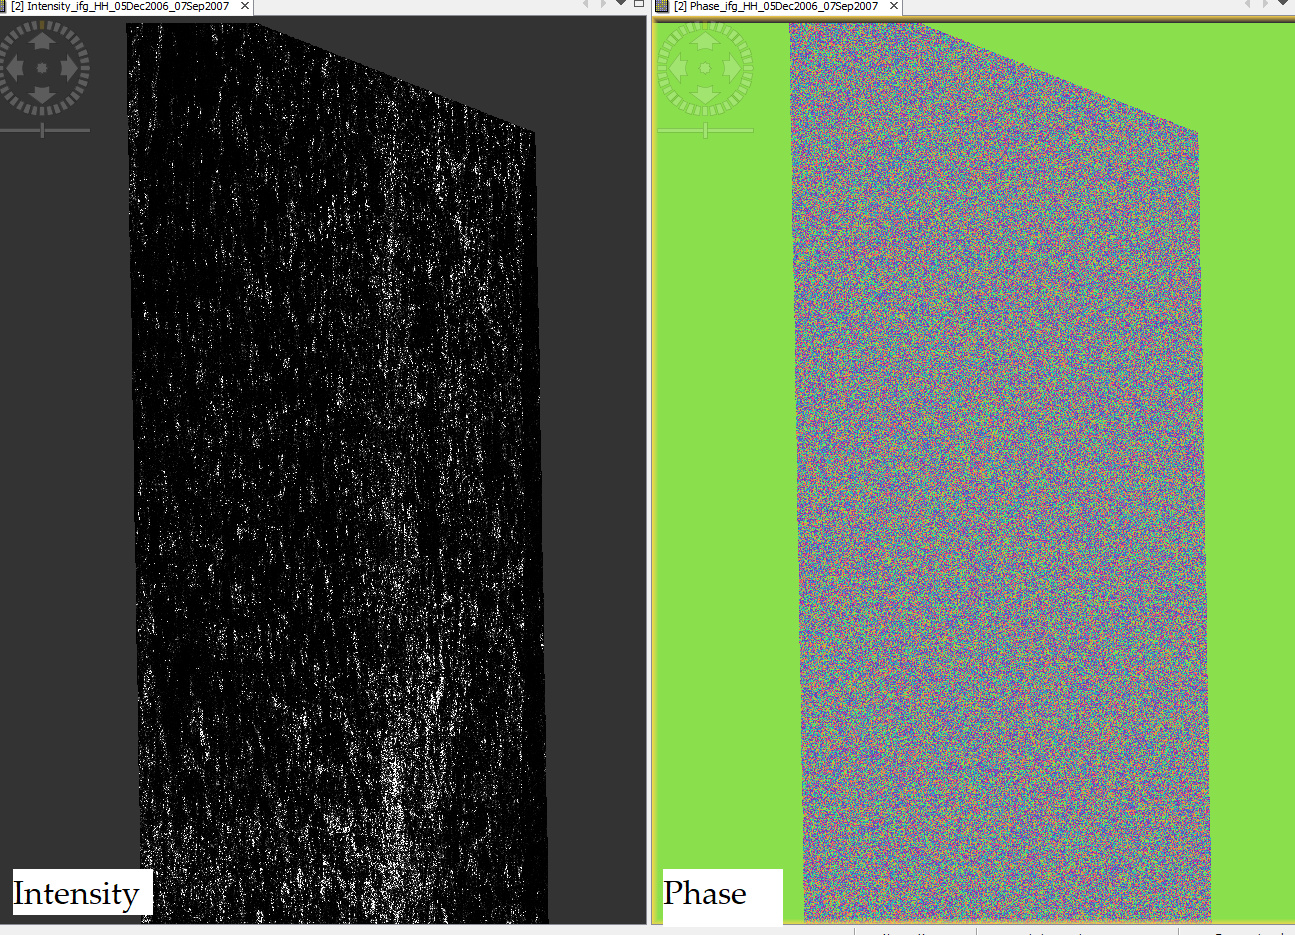
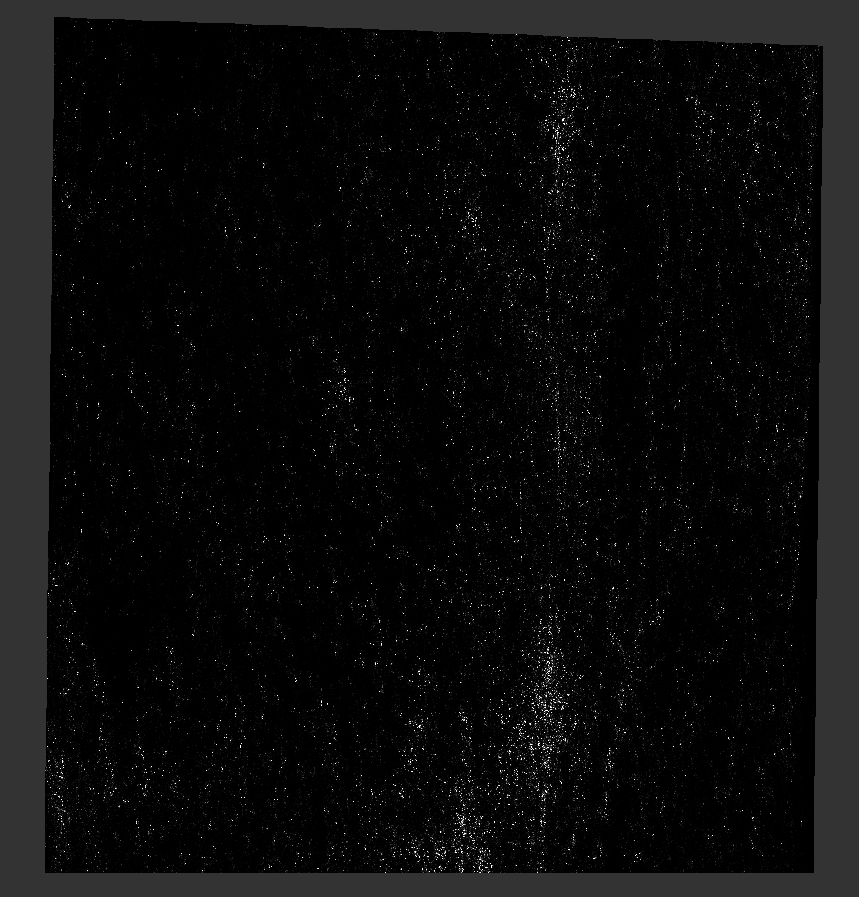
I would have expected at least some patterns in the interferogram. Is the urban area visible in the coherence image?
Urban area is not visible in the coherence image. May be I should change the data.
in this case, the coregistration was not successful.
Try DEM-based coregistration
hello
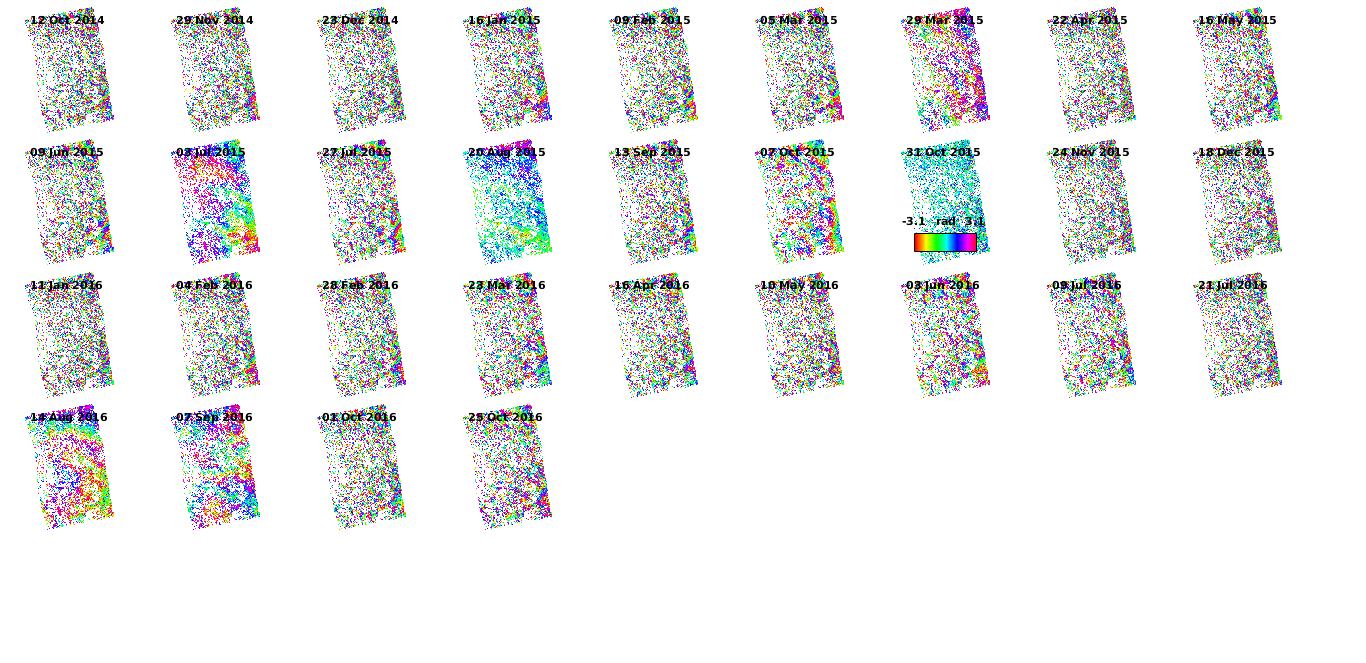
I want to detect deformation in mine pit. so I work on 31 SLC sentinel-1A from 2014 to 2016 an processed them in SNAP 6 based on workflow that I found in this topic (and forum) for PSI method. I took export for StaMPS and follow steps in manual . After step 5 in StaMPS (using ps_plot(‘w’)) , I think there is a problem with the results. it seems the number of PS is low and noise is high . is it true or not ?
there is my result.
Because this is still wrapped phase, stamps(6,6) is the unwrapping step, after applying it, apply step 7, then reapply step 6,
Later on, apply, ps_plot(‘u-dm’)
We’ll compare the results then,
1 Like
You could now apply, ps_plot(‘u-dmo’) to visualize the unwrapped interfergrams with the subtracted ramps, then it’s possible to check up how much the Interferogrms are smooth and well unwrapped.
1 Like
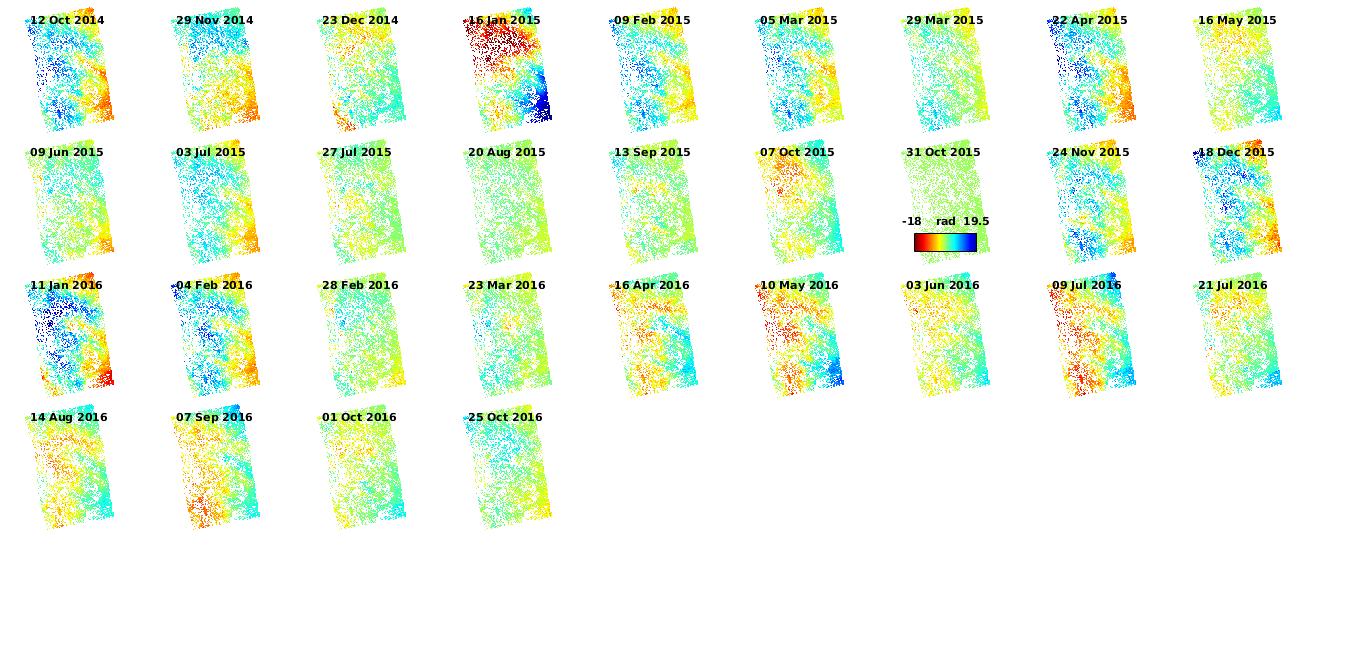
this is result of ps_plot (‘u-dmo’):
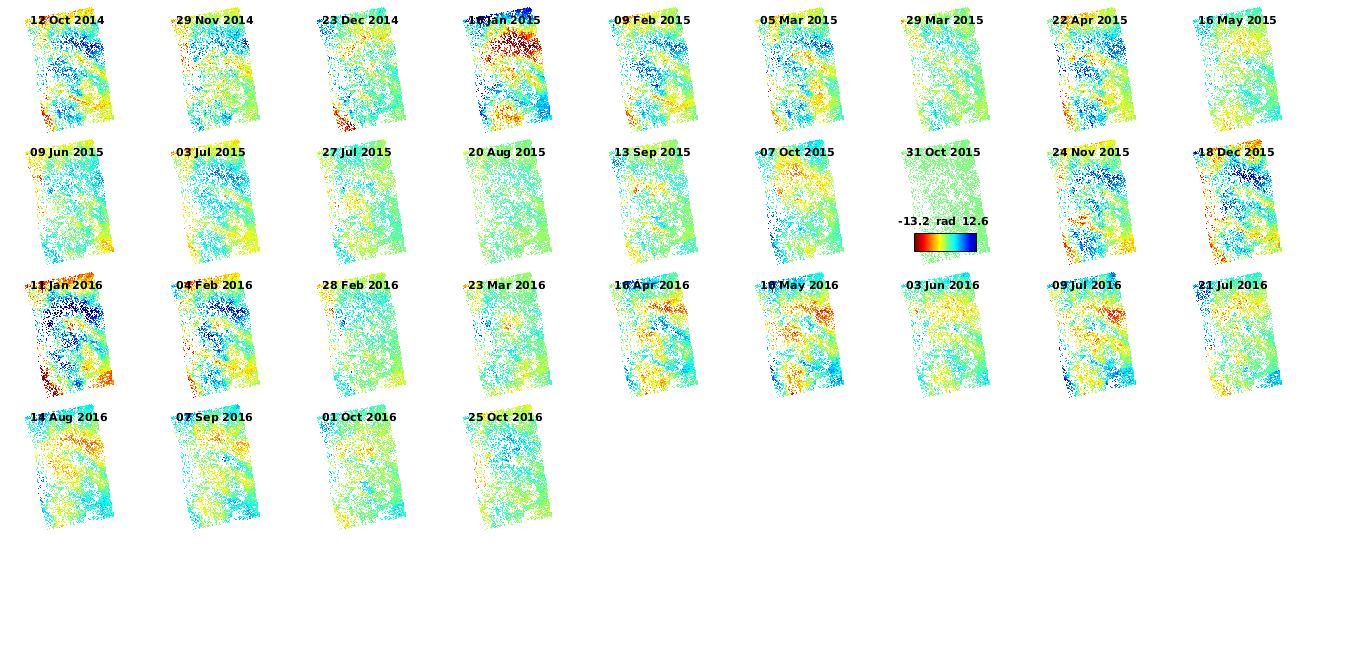
it seems most of them smooth. should I add any of them to
scla_drop_index and rerun Step 7?
thanks
Would you please to take a look at my case,
Please read this post,