Hi all,
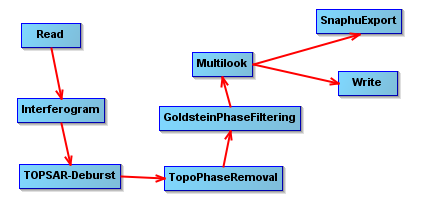
I have created my Graph from a coregistered SENTINEL-1 TOPS InSAR pair to prepare my data before Phase unwrapping in SNAPHU. Therefore I input a coregistered pair and let it run until the SNAPHU export function. No problem for this. I then unwrap the dataset from the LINUX virtual machine and get a dataset supposedly ready for import in SNAP/SNAPHU import function. The problem arrives when I input the wrapped phase and the unwrapped phase in the SNAPHU Import GUI. It tells me that at least one product with INSAR metadata is needed. How do I provide this when I get a dataset prepared from a Graph ? There is no .dim file associated to my output. Can I use the one from the coregistered input pair ? Thanks for your suggestion/help/support
If your only writer is for the snaphu export then I can see where you may run into this problem. Add another writer to dimap and connect it the same operator as teh snaphu export is connected to.
Thank you for this fast reply. I will try this very soon and report afterwards.
Yes it actually works better now. Thanks for the tip.
Well, something strange is now going on.
Why doesn’t it work any longer with the S1TBX 3.0.3 ? I mean , before i could use this graph to process an interferometric pair from the coregistered stack to the SNAPHU Export ==>
… and now I get this error message preventing the script from running ==>
![]()
What is happening ? Thanks for any help.
Check the output of multilook that it isn’t producing intensities. It should have the complex bands and a phase band.
There are actually no way to do anything from the Multilook Tab of the graph GUI. The source bands window of the Multilook tab remains empty. It just looks like my input pair (made from the (S1 TOPS Coregistration tool) is not read once selected at the very first “Read” step.
Edit: That’s strange, but a workaround to solve this issue is to delete the SnaphuExport step. The multilook source bands window suddenly fills up and then re-add the SnaphuExport function into the graph. That’s kind of weird behavior as I am pretty sure that the same graph was working perfectly well in the previous versions.