Good morning.
Please, could you tell me exactly what is the x-axis in this histogram?
Thanks in advance.
Good morning.
Please, could you tell me exactly what is the x-axis in this histogram?
Thanks in advance.
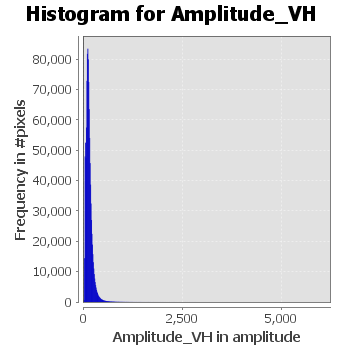
These are the values of the band you have selected to create the histogram for. So the x-axis is dependent on what you are doing. The y-axis gives the frequency (the count) of the values. Where several values are accounted in one bin. That’s how histograms are done.
Doing some research in the internet reveals great resources.
My problem is that I have always used histogram with gray level at the x-axis but now in SNAP I work not with a jpeg for example.
So is it correct to write in a document only that the x-axis rappresent values of the band?
Thanks in advance
Yes, as there is no other source for the values. Or do you expect something else?
Thanks,
in this case values of band are not gray level but how could I define this values?
Maybe I misunderstood.
The amplitude is the measurement of SAR sensors.
Maybe this link clarifies it a bit.
http://elib.dlr.de/82313/1/SAR-Tutorial-March-2013.pdf