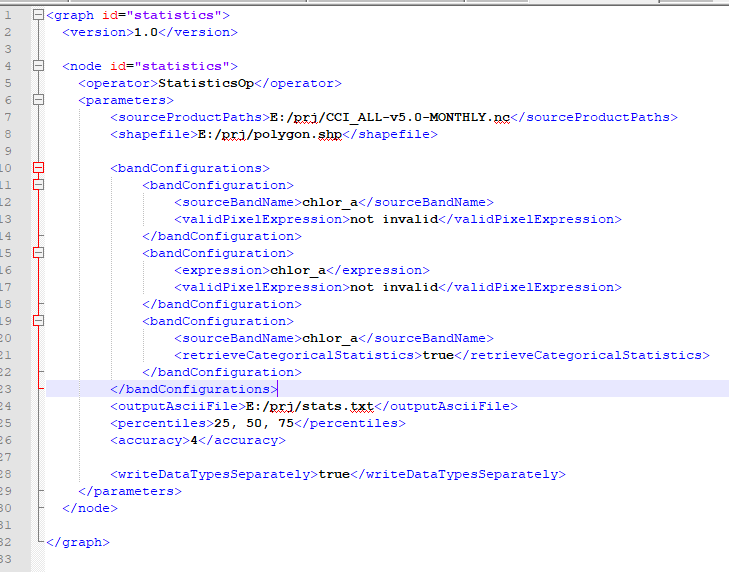
This post shall help to explain how to set up a StatisticsOp graph and what is the meaning of its parameters. An example graph is attached. The StatisticsOp will, unlike other SNAP operators, not create an output product but instead write statistics to either a .csv-file or an ESRI shapefile. Note that this graph works with SNAP 6.0.3. If you work with earlier versions, some of the parameters are not available.
First, the StatisticsOp offers two ways to specify source products: Either by setting sourceProducts explicitly or sourceProductPaths. sourceProductPaths is a convenient way if you want to process multiple products which are located in the same directory. sourceProducts can be set with the following call:
gpt statistics-graph.xml -SsourceProducts=first_product.dim second_product.dim
You can specify that you want to retrieve statistics for specific regions by stating an ESRI shapefile. Statistics will be derived for each geometry in that shapefile separately.
You might also specify that you are only interested in data in a certain time range by setting a start and an end date (in the form year-month-day hour_of_day:minute:second). Products before the start date or after the end date will not be considered. Statistics will be aggregated for the time period, unless you specify a time interval with the interval parameter. There you may set the unit (either days, weeks, months or years) and the amount of temporal units. So, if you choose “2 days”, statistics will be aggregated for that time interval. This parameter only has an effect when start and end dates are set.
With bandConfigurations you can specify which bands you are interested in. You need to specify at least one bandConfiguration. A bandConfiguration must consist at least of either the name of a band (sourceBandName) or an expression from which a band can be computed (expression). Also, you might set a validPixelExpression to mask out pixels. If the band is an integer band, you can set the parameter retrieveCategoricalStatistics to true. This will cause that you don’t retrieve mean, max, or min from a band, but that you count the number of pixels per class and determine the classes with most and second most members.
You can then set the name of a shapefile to which you want to write the retrieved statistics (outputShapefile) and the name of an ascii text file to which the statstics are written in a .csv-format (outputAsciiFile). Note that when you set neither you will not get any results. For both the output shapefile and the output ascii file an accompanying metadata file will be created which documents the meaning of the attribute names.
When retrieving quantitative measures, you can ask to retrieve values for certain percentiles (percentiles) and the accuracy (accuracy) with which to retrieve values. A lower accuracy will result in a faster operator.
Finally, if you retrieve both quantitative and qualitative/categorical measures, you can choose to write these to separate output files (writeDataTypesSeparately). This option helps to keep the files manageable. If it is set, the file names will be extended with the terms categorical and quantitative, respectively.
statistics-graph.xml (1.2 KB)
 i’ve made a kind of graph by a xml file, but when it runs, it generates a file (.txt) but blanked, and the error message that appears on cmd window is: Error: org.esa.snap.core.gpf.OperatorException
