I have generated a dem from sentinel-1 SLC IW product for mountainous region of pakistan. After comapring results with STRM 1 arcsec dem and Alos found a huge difference between them. Sentinel-1 dem have negative values and more high values than other two for detail screenshot is attached. 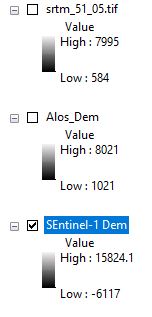
Sentinel-1 is not the best source to create a DEM, because of many reasons (perpendicular baseline, temporal decorrelation between two images, comparably short wavelength…).
What you can expect from your data is already indicated after the interferogram step where you get the coherence as a first quality measure. Furthermore, the interferogram should show clear and topographically-related fringes. If these are not given at an early stage, there is little hope that you will get a proper DEM in the end.
To be honest, I have rarely seen any DEM which was at least comparable to the quality of SRTM or AW3D30.
Please have a look at this commend: Phase to elevation error
Also some important remarks here: Using VV and VH to make DEM
And discussions on error sources
- atmosphere Interpreting Wrapped and Unwrapped Interferometric Phase of Philippine Active Volcanoes
- decorrelation How can we calculate the volume of displaced material with displacement band(displacement_VV)?
Can you please share the image dates of your products and a screenshot of your interferogram and coherence (including color scale)?
1 Like
@ABraun thank you very much for your response.
Image Dates

S1A_IW_SLC__1SDV_20190315T125659_20190315T125726_026349_02F266_8B6F
Steps Followed
- S-1 TOPS Coregistration
- Interferogram Formation ( without topographic phase removal )
- S-1 TOPS Deburst
- Goldstein Phase Filtering
- Snaphu Export
- Run unwrapping
- Snaphu Import
- Phase to Elevation
- Range-Doppler Terrain Correction
Few days back i generated another dem of an Australian region following an ASF tutorial and results were good after comapring with ALOS and SRTM.
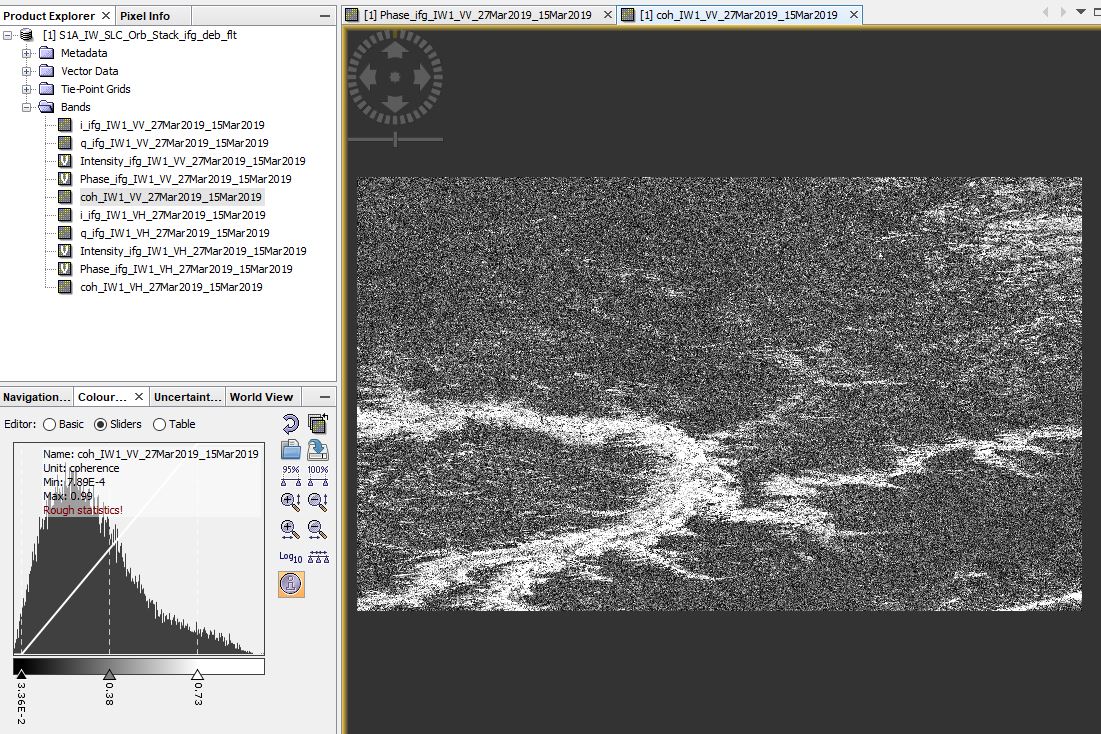
I think the decorrelation because of snow and vegetation is too high and only leaves sufficient coherence over the glacier area.
As you see in the interferogram, it does not reflect the topographic variations. To get a usable DEM (as you might have retrieved in Australia where you have very dry conditions and probably only little vegetation cover), you need to have clear fringe patterns over the entire image. Otherwise you will generate random values in the unwrapping step.
You can check for image pairs with lager perpendicular baseline (> 150 m) and preferably from the dry season. But from the technical perspective you will always be limited by wavelength and decorrelation.
Thank you very much @ABraun for your time.